![Figure 3: Passenger transport by car, van, and taxi and percentage of children travelling to primary school alone. Sources: Transport Statistics of Great Britain, NTS, 2014, 2013 [NTS0616]. Hillman, M., Adams, J., and Whitelegg, J 1990. One false move. London: Policy Studies Institute](/files/77034-l.jpg)
The Equality Act 2010 firmly placed the onus on councils to advance equal access to services and opportunities to all those with protected characteristics. However, the term ‘inclusive design’ tends to conjure up an image of someone who is disabled rather than someone with one of the other protected characteristics: a pregnant woman, an older person, a child. The DfT’s 2018 ‘Inclusive Transport Strategy’ focusses on access for the disabled as does their Inclusive Transport Leaders scheme initiative.
The DfT’s 2020 Network Management Duty guidance was, in many ways, an excellent response to the Covid-19 crisis, creating a statutory requirement for transport authorities in England to consider introducing pop-up cycle lanes, Low Traffic Neighbourhoods (LTNs) and School Streets. However, the guidance on complying with the public sector equality duty highlights the implications of these schemes for disabled people. These are obviously important, but so too are the implications for older people, women and particularly children.
Non-disabled protected groups make up a large proportion of society. Perhaps because they are not a minority, we forget their travel needs may be specific. Women in their thirties, for example, do four times the distance of escorting education trips and half the distance of commuting trips compared with men of the same age. For children aged 0-16 ‘visiting friends’ is the most significant trip in terms of distance while going to school is the most frequent trip type. Many of their trips are short and could be walked or cycled if road environments were made suitable.
The commute is only 15% of trips made in England (2019 data, DfT, NTS0611). Or at least it was. With homeworking now more common due to Covid-19, the commute – unlike travel to school – is a diminishing proportion of trips.
Whether measured in distance or trip numbers the commute is not the most significant trip for females or many of those with protected characteristics. Yet transport planning and highways engineering have long been (and remain) focussed on the commute.
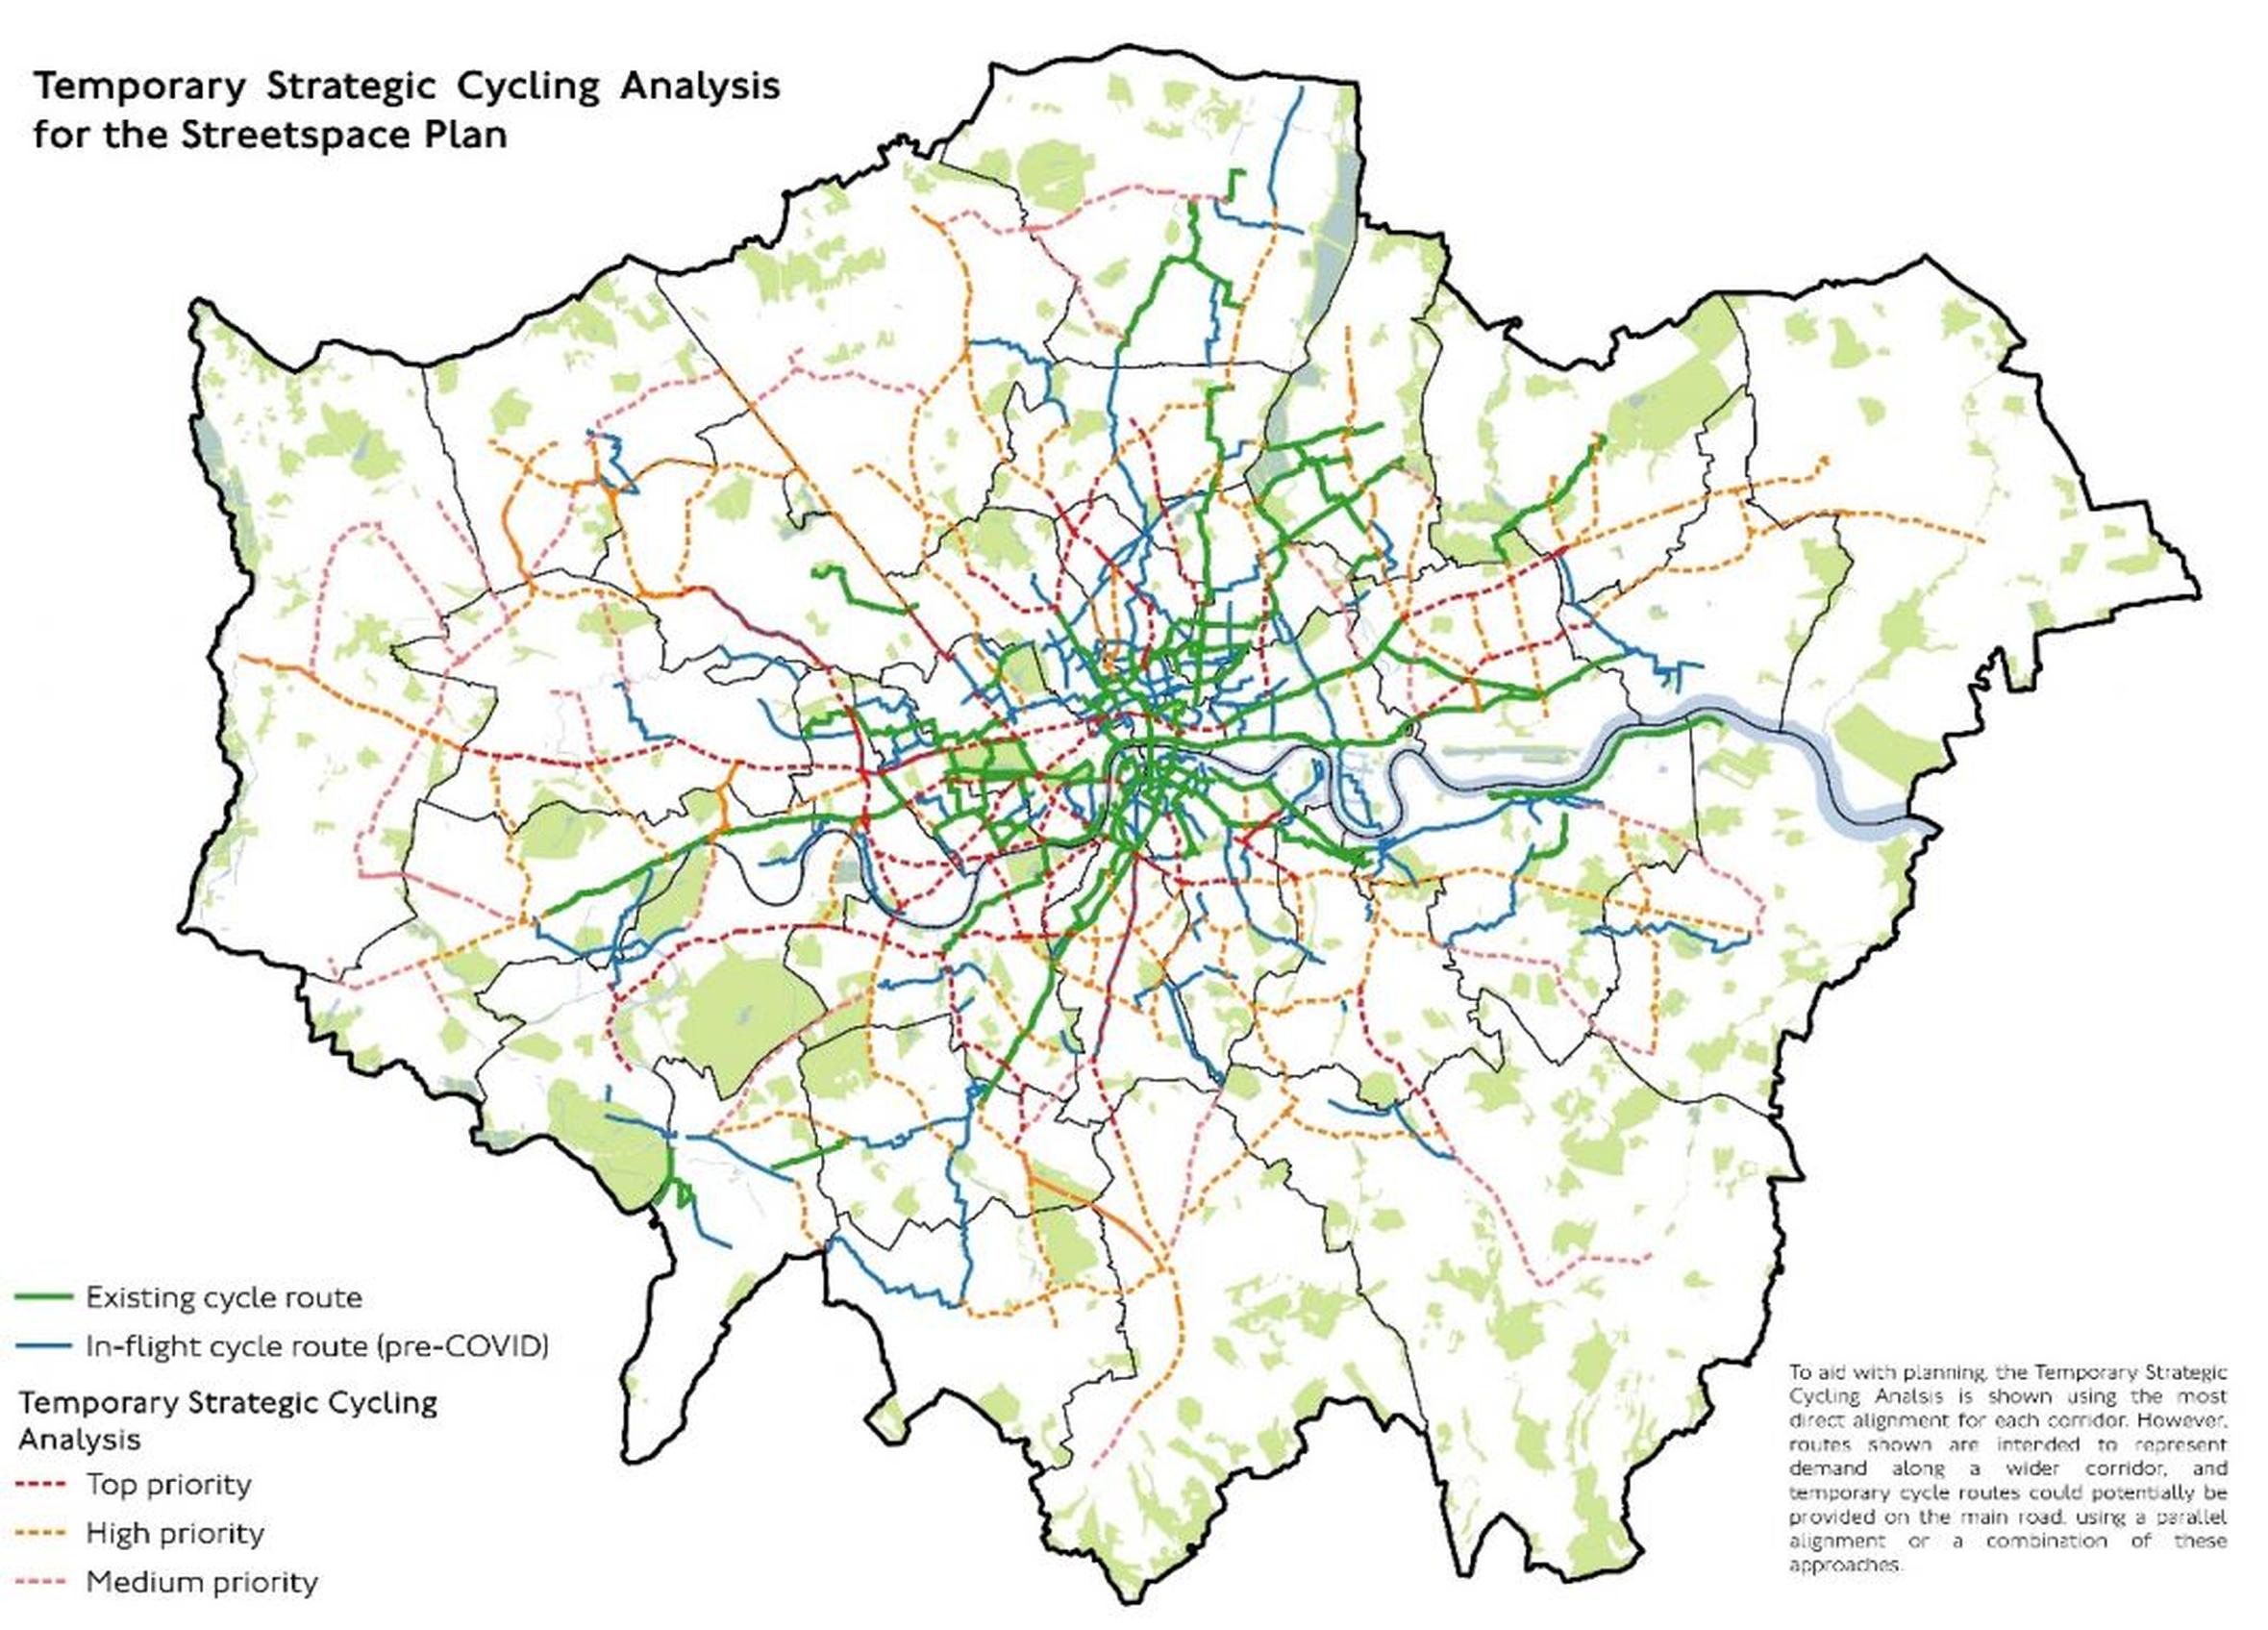
In London, for example, the quality and coherence of the cycle network improves as you move into the centre, while safe cycle routes are few and far between in many outer London boroughs1. The Temporary Strategic Cycling Analysis Streetspace Plan 2020 (Figure 1) is a spider-like diagram with routes into and out of the centre following commuter desire lines.
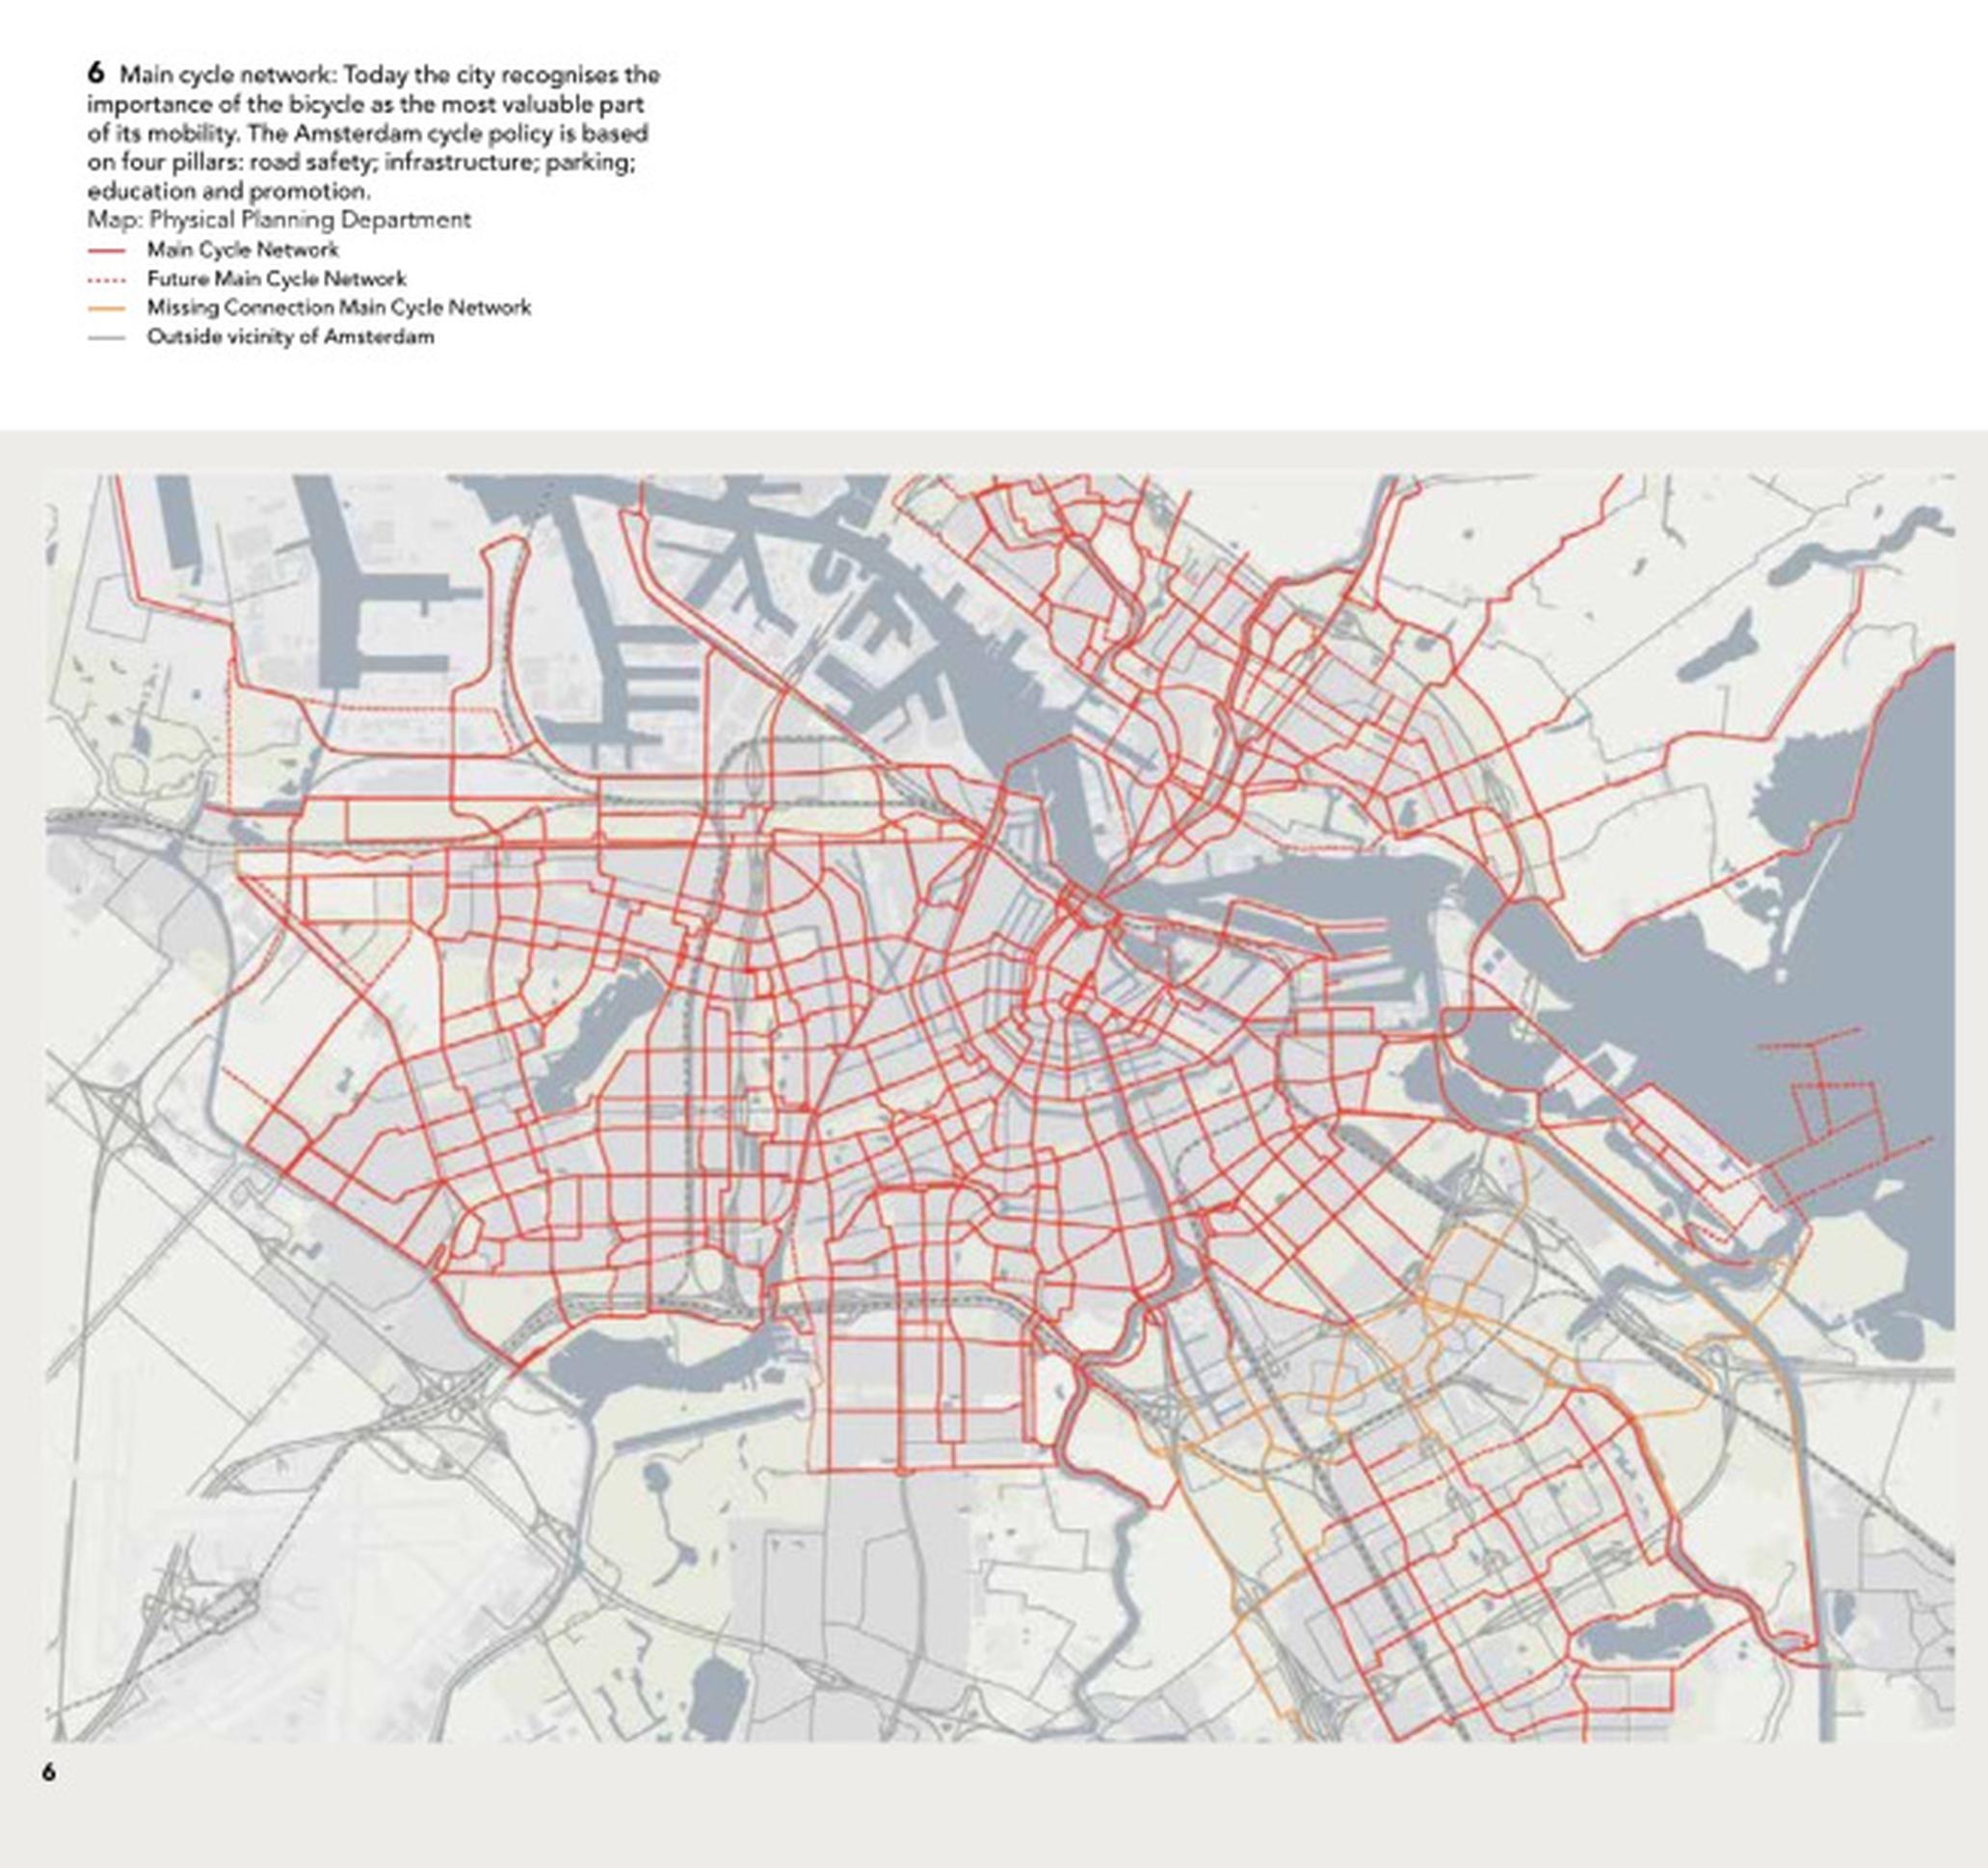
If we were to plan for ‘non-work’ – i.e.: most – trips the cycle plan would look more like a fine grid network, with as much funding, importance and care given to those journeys made by children going to school in outer London as adults going to work in inner London; it would look more like the kind of network shown in Figure 2.
Research suggests that to achieve greater diversity in cycling, we need to think beyond the commute, “making neighbourhoods cycling friendly and developing safer routes to school, should be equally high on the agenda as cycling corridors that often cater to commuting traffic”2.
The quickest and cheapest way to enable cycling for short trips in neighbourhoods is by removing through traffic (crossings and protected routes on main roads can then be added to create a fine grid cycle network). The Transport for London Streetscape Strategic Neighbourhood Analysis plan could help address this if LTNs were consistently implemented across London. But whereas the strategic cycle routes may sit under TfL control, most roads flagged by TfL as having LTN potential are controlled by boroughs whose commitment to reducing traffic varies enormously from one borough to another. And the gap is widening; some boroughs are planning and building low traffic neighbourhoods across their whole area over a specified timeframe (say three or five years) while others have no borough-wide plan and have rejected or removed schemes.
This is an equality issue. Those who make shorter more ‘cyclable’ trips – women, children, older people but also ethnic minorities – stand to benefit most from being able to use local roads for cycling. Their marginalisation is compounded by two factors. First, a systematic review found cycling with busy traffic is hugely off-putting particularly for women, and probably also older people and those riding with children. Second, those most put off cycling in traffic are typically less physically able to cycle long distances than young adult men. But the most direct routes are usually heavily trafficked, due to the planned prioritisation of motoring. The extra distance of a circuitous, quiet route is more of a challenge to those who avoid busy roads.
In other words, those with protected characteristics are most disadvantaged by their council’s reluctance to remove through traffic and provide road environments which are safe and comfortable for short trips. In their decision-making authorities must engage with those with protected characteristics, including children4, who they have a duty of care to protect.
Where councils reject traffic-cutting measures which reduce casualties – and there is now solid evidence that LTNs do reduce road danger – it potentially increases the authority’s liability. A court might find in favour of someone who is subsequently injured by, say, an HGV driver on one of those roads, particularly if there were unconvincing reasons for not implementing the LTN at the location in question.This would be rather like a doctor withholding preventative medicine being sued for negligence.
Perhaps our commute obsession is not surprising. Much of the best data collected relates to the commute. (Though it is probably a chicken and egg situation with commute-think shaping our perception of ‘normal’ trips, which influences what we measure, which in turn determines what we fund and build).
The 10-yearly ONS Census provides some of the most in-depth, reliable national travel data, and, as it says on the Government website, the data gathered is used to help decide “the planning and funding of public services”.5 The Census transport questions relate solely to work journeys, potentially skewing planning and funding away from those who should be protected by the Equality Act and further failing those who do not fit the commuting mould.
Equivalent data does not exist for child travel. National school travel data for state-maintained schools was collected between 2008 and 2011 but the questions relating to travel were subsequently dropped from the School Census. Today, some schools have excellent post code data, others do not. Some authorities hold travel to school data, others do not. Not only is commute data better quality; it is also more accessible.
The absence of rigorous, national school travel data suggests children’s mobility is not valued as highly as adult commuting. This data gap is a barrier to research and inclusive transport planning. As Dr Anna Goodman, who was part of the Propensity to Cycle Tool (PCT) team, explains: “If we had that data, we could do really high-quality research into the impact that school streets or low traffic neighbourhoods have on travel to school. As it is, we haven't got very far beyond anecdote on those questions.”
The questions could be re-instated into the School Census. Or we could emulate Scotland6 and include school travel questions in our 10-yearly National Census.
There are other possibilities for data collection to support inclusive, active travel. “Monitoring and publication of open data on the effectiveness of schemes nationwide could be made a key part of the government’s investment strategy,” says Dr Robin Lovelace, also from the PCT team. Making better use of datasets that already exist, including publishing anonymous and aggregated origin-destination data representing travel to school flows, and expansion of the Modeshift Stars project to evaluate mode shift potential in schools would help fill this data gap, says Lovelace: “There is a wealth of data out there and using it to identify where short car trips can be replaced with healthy walking and cycling routes is a priority.”
If we want transport infrastructure that provides for all, we need to start measuring and planning for trips to the shops, school and the park.
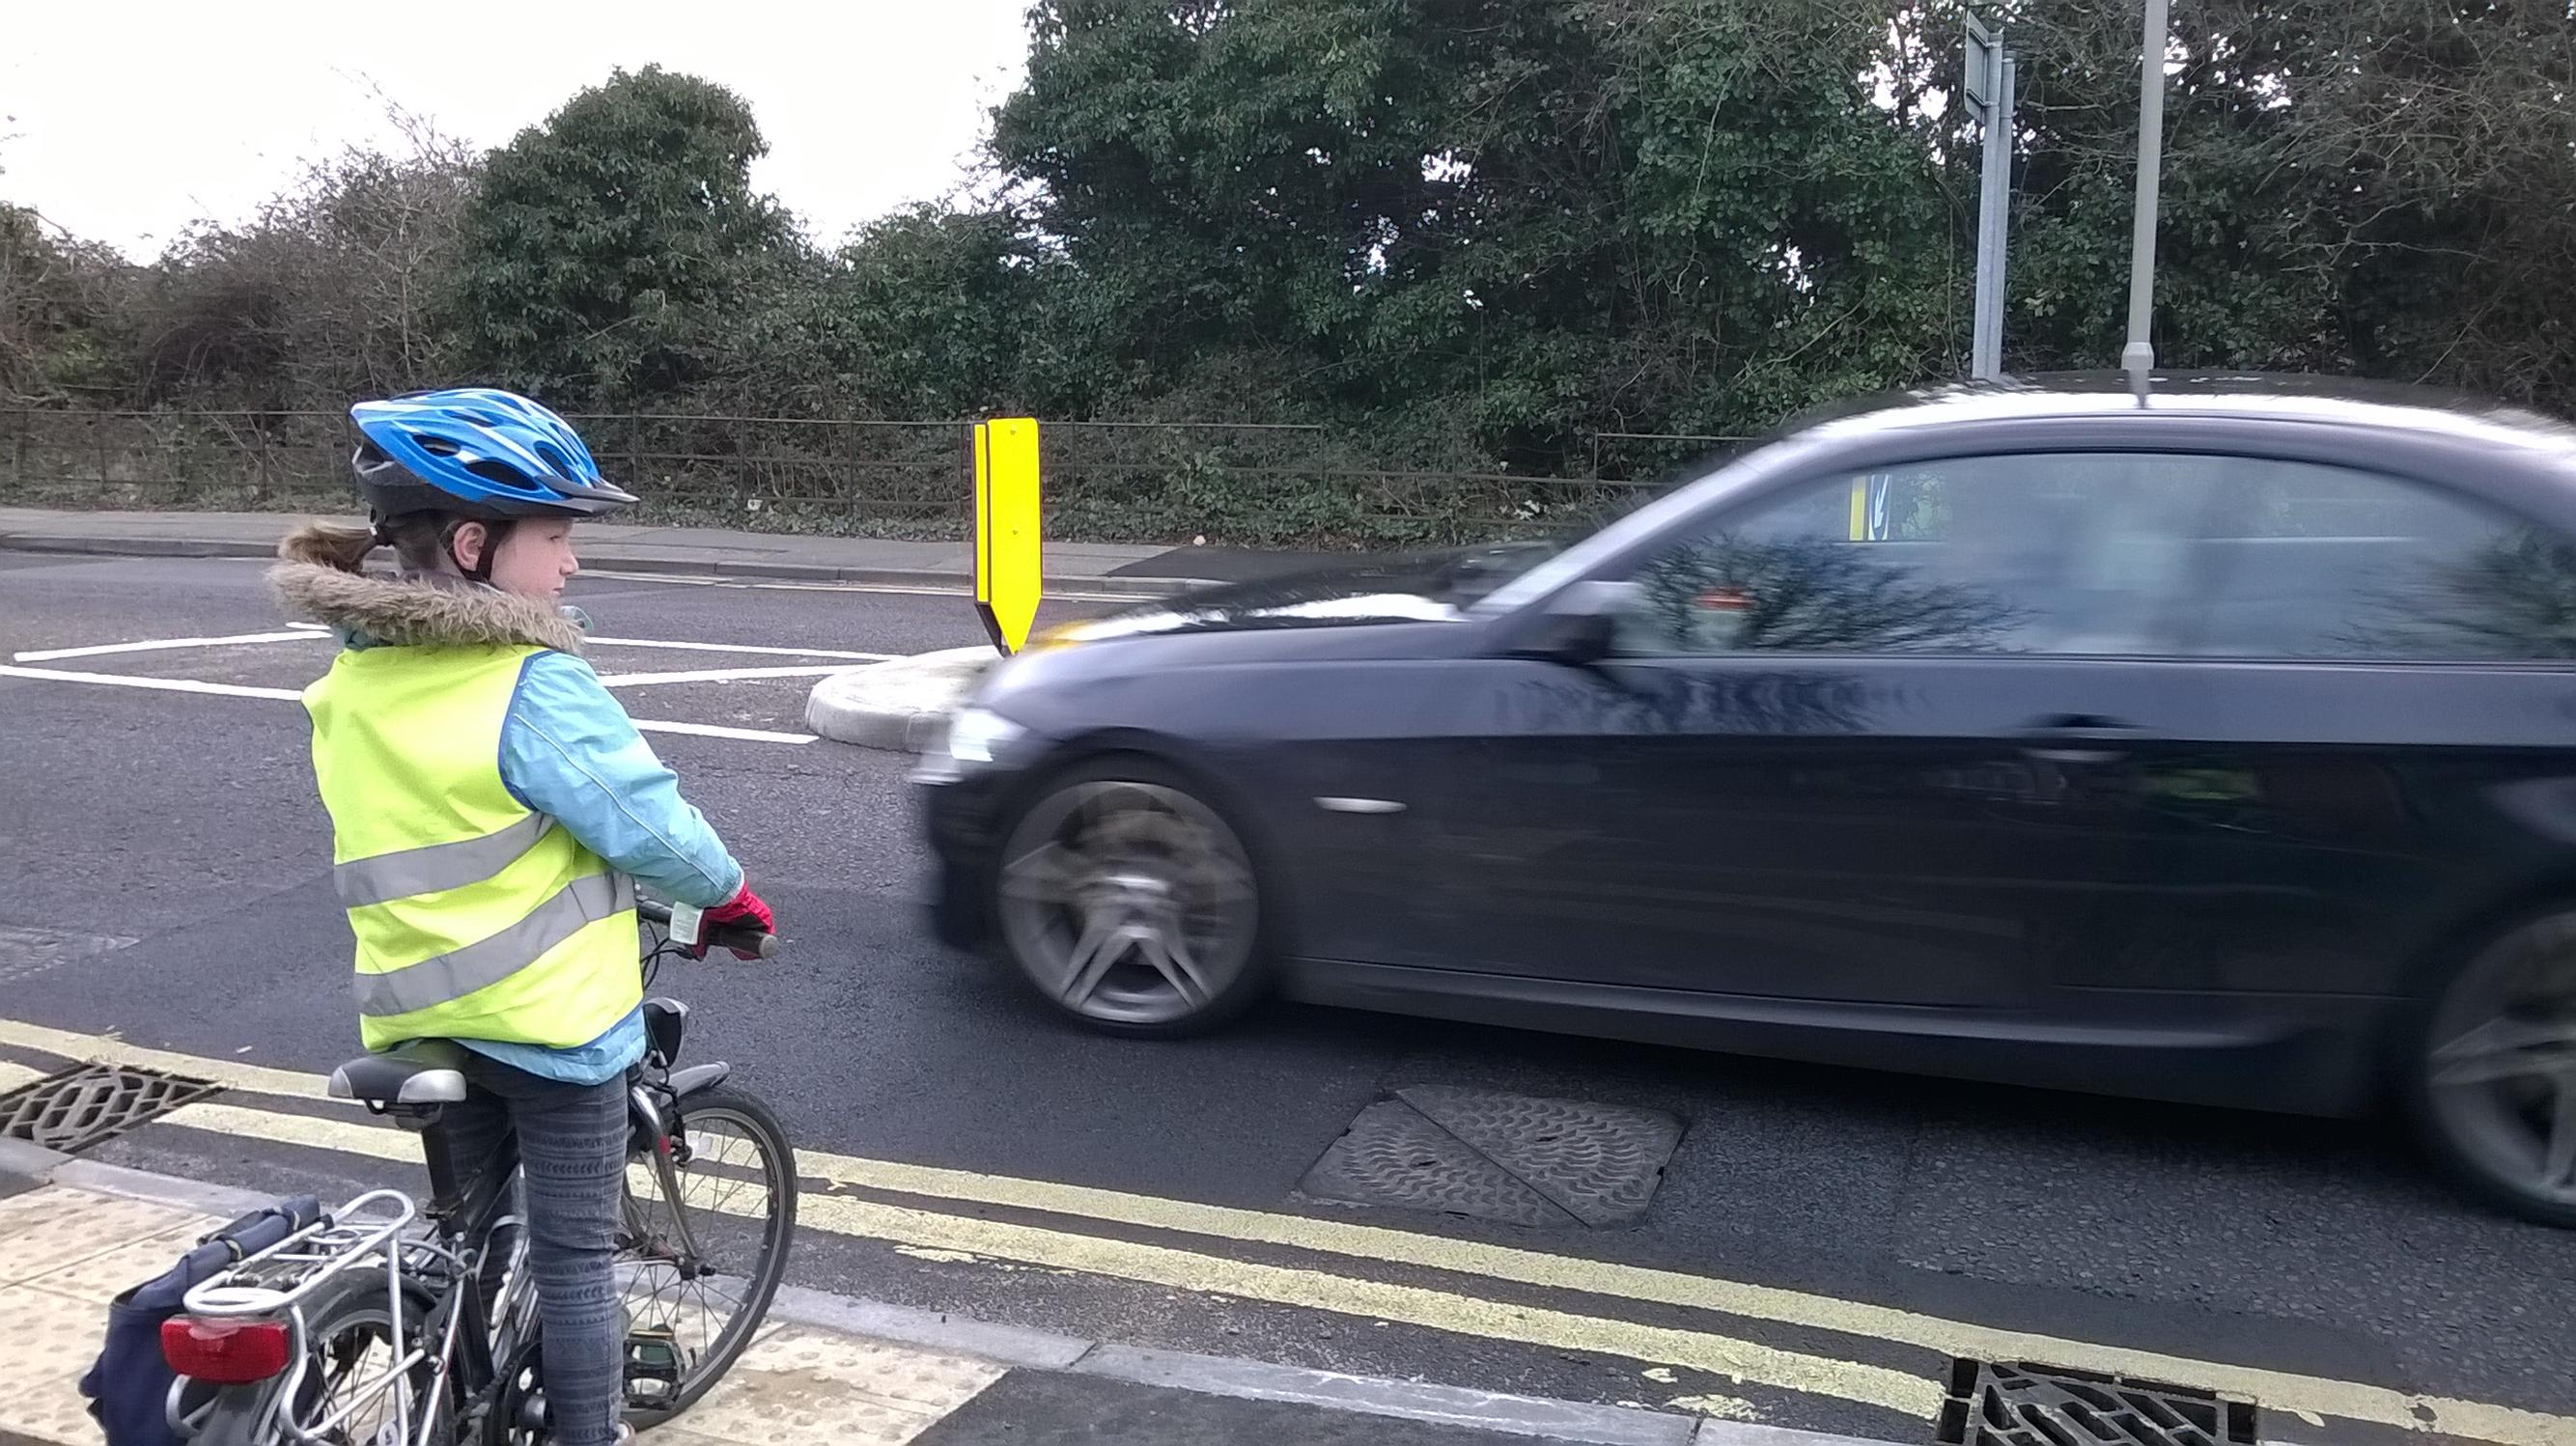
Children’s freedom of movement has been dramatically eroded over the past half century and is negatively correlated with adult’s increased ‘freedom’ to drive (Figure 3). Parents’ reluctance to allow children to travel alone in the face of prevalent car use is understandable. Over three-quarters of injury deaths for 10 to 18-year-olds are related to motor traffic7 and motor traffic injuries are the leading cause of death for children aged 5 to 14 years89.
Children are often described as ‘vulnerable road users’ but this clouds the issue of road safety; it implies vulnerability is an innate attribute, which causes a person to be susceptible to injury, shifting the focus onto the potential victim. But it is external factors – mixing with heavy, fast vehicles, the designed-in dangers (insufficient priority crossings, lack of protected cycling infrastructure) and an aggressive road culture enabled by weak legal driver accountability which make children ‘vulnerable’.
As with the ‘social model of disability’, which says that people are disabled by barriers created by society, we also need a ‘social model of vulnerability’. This would recognise that a person’s vulnerability is created largely by the physical environment, attitudes and laws, rather than innate attributes. UK highways engineering demands behaviours and skills outside the cognitive, developmental, behavioural, physical, or sensory development of the youngest in our society.10 Children cannot use standard British roads without risk of injury, but the deficiency lies with planning and highways design, not children.
‘Inclusive’ design guidance tends to focus on the physical barriers which prevent accessibility (steps, railings, kerbs and so on). But for children (and others) the main barrier to movement – motor traffic – is virtually omnipresent. A residential street closed to through traffic is a road open to walking and cycling, especially for those who have a stronger preference not to mix with motor traffic. As Playing Out point out, “‘Active travel’ for children is their only means of independent travel” 11.
Restraining traffic is therefore critical, not only for injury-prevention, health, and climate reasons, but also to liberate children.
Roger Geffen, policy director at Cycling UK, says: “I sometimes wonder what would happen if children were put in charge of our transport system. By focusing on their own travel needs and the day-to-day trips they make with their parents, they’d go a long way towards tackling the obesity, pollution, road danger and climate crises. The results would benefit people in every other demographic group too.”
National progress with the equity agenda is likely to arrive in the form of targets to cut emissions from transport, changes to the Highway Code and the re-drafting of Manual for Streets, which provide an opportunity to put children back in the picture, protect them better from adult drivers, and place their needs at the heart of highways design. The potential gains are massive; 1.8% of children cycle to school but if Dutch levels of cycling were reached this would rise to 41%12.
Over the last 20 years cycle use in the UK has hovered at less than 2% of all trips. We must start building for pedestrian and cycle traffic and cutting motor traffic at a pace and scale not yet seen. In London cycling mode share was 1.2% in 2000 rising to 2.4% in 201913. If cycling levels continue to rise at that rate, it will take over 500 years to reach the levels of cycling now seen in cities such as Amsterdam (where cycling mode share is 36%14).
We must accelerate the pace of change to meet the climate and health crises, but also to meet our moral obligations to children and others we are supposed to be protecting. Streets which work for children work for all
Lucy Marstrand-Taussig is technical lead for walking and cycling at Metis Consultants
2 Goel, R., Goodman, A., Aldred, R., Nakamura, R., Tatah, L., Garcia, L.M.T., Diomedi-Zapata, B., de Sa, T.H., Tiwari, G., de Nazelle, A. and Tainio, M., 2021. Cycling behaviour in 17 countries across 6 continents: levels of cycling, who cycles, for what purpose, and how far?. Transport Reviews, pp.1-24.
3 Aldred, R., Elliott, B., Woodcock, J. and Goodman, A., 2017. Cycling provision separated from motor traffic: a systematic review exploring whether stated preferences vary by gender and age. Transport Reviews, 37(1), pp.29-55.
4 Local Transport Note 1/20, para 3.3.5
5 https://census.gov.uk/about-the-census
6 Method of travel to place of work or study | Scotland's Census (scotlandscensus.gov.uk))
7 https://www.rcpch.ac.uk/resources/why-children-die-research-recommendations
8 J., Read. I-walk innovations, 2020
9 Racioppi, F., Eriksson, L., Tingvall, C., Villaveces, A. and World Health Organization, 2004. Preventing road traffic injury: a public health perspective for Europe (No. EUR/04/5046197). Copenhagen: WHO Regional Office for Europe.
10 Schieber, R.A. and Thompson, N.J., 1996. Developmental risk factors for childhood pedestrian injuries. Injury Prevention, 2(3), p.228.
11 Playing Out Response to DfT Network Management Duty Guidance changes Nov 2020
12 Goodman, A., Rojas, I.F., Woodcock, J., Aldred, R., Berkoff, N., Morgan, M., Abbas, A. and Lovelace, R., 2019. Scenarios of cycling to school in England, and associated health and carbon impacts: Application of the ‘Propensity to Cycle Tool’. Journal of Transport & Health, 12, pp.263-278.
13 Travel in London Report 13, 2020, page 56
14 https://www.linkedin.com/pulse/amsterdam-city-powered-cycling-civitas-handshake/
TransportXtra is part of Landor LINKS
![]()
© 2025 TransportXtra | Landor LINKS Ltd | All Rights Reserved
Subscriptions, Magazines & Online Access Enquires
[Frequently Asked Questions]
Email: subs.ltt@landor.co.uk | Tel: +44 (0) 20 7091 7959
Shop & Accounts Enquires
Email: accounts@landor.co.uk | Tel: +44 (0) 20 7091 7855
Advertising Sales & Recruitment Enquires
Email: daniel@landor.co.uk | Tel: +44 (0) 20 7091 7861
Events & Conference Enquires
Email: conferences@landor.co.uk | Tel: +44 (0) 20 7091 7865
Press Releases & Editorial Enquires
Email: info@transportxtra.com | Tel: +44 (0) 20 7091 7875
Privacy Policy | Terms and Conditions | Advertise
Web design london by Brainiac Media 2020