
Transportation forecasting models were first implemented in the 1950s, back in the days of punch-cards and mainframe computers. Yet advances in modelling techniques, computing power and data availability have not been accompanied by a systematic uptick in predictive performance. Fact. So a more fruitful line of enquiry might switch attention from production to consumption. How can investors become smarter consumers of traffic forecasts? A good place to start is by improving our understanding of a (if not the) key explanatory variable: demographics.
Many of the growth models underpinning the demand projections for toll roads – and other transportation assets – rely to some extent on population forecasts. Yet failure to dig beneath headline numbers such as regional trends or state-wide statistics can lead to deceptive conclusions. A review of the demographic literature, specifically from the perspective of travel demand models, proves insightful. It explains why traffic forecasters (and unsuspecting investors) can find themselves particularly exposed to input variable uncertainty.
The demand for transport is the classic ‘derived demand’. Users consume the service not because they benefit directly, but because they want to consume something somewhere else. If you want to forecast transportation demand in the service area of a toll road, for example, you need to forecast the population that could generate that demand. In terms of potential users, this starts to address the question ‘how many?’, and traffic consultants’ reports often focus there. The follow-up questions of ‘who?’, ‘where?’ and ‘how?’ attract less attention. More worrying, the uncertainties associated with population projections are seldom explored (if mentioned at all) by traffic consultants, yet these uncertainties are well documented by demographic forecasters.
The questions of ‘who?’ and ‘how?’ are inextricably linked as different population cohorts influence the demand for travel in very different ways. An outlook of robust and sustained area-wide population growth of, say, 3-4 per cent per year initially sounds reassuring in terms of supporting strong traffic demand, yet consider the following:
Income: Population growth that is driven primarily by lower-income (price-sensitive) sections of the community may be unhelpful in terms of toll road demand; especially if future tariffs escalate in real-terms (and wages fail to keep pace).
Age: In many OECD countries the most rapidly growing sections of the community are seniors (65+) and mature seniors (85+); market segments that drive fewer miles (often considerably fewer miles) than average. And the under-30s (‘millennials’) have been associated with driving habits and car ownership/usage preferences that differ markedly from the middle-aged. For employed persons aged 16-34 in the US, miles travelled fell by 16 per cent from 2001 to 2009. And driving licence attainment among young adults has reduced year-on-year for the past 30 years (and, for 16-year-olds, has almost halved). Regarded by some as a transitory phenomenon, these trends may moderate. Notwithstanding in terms of travel demand, age profile is an important consideration.
Immigration: Some commentators distinguish between migration (domestic movement) and immigration (international movement), an important distinction when it comes to the influence on travel demand. One question to ask is: ‘in terms of population growth, how significant is immigration’? The answer can be surprising. A recent study by the Pew Research Center reveals that 88 per cent of US population growth over the next 50 years will be driven by immigrants and their descendants. The authors conclude that ‘without immigrants, the US population would start decreasing’. The same is true of other countries. And the distinct and differentiated influences on travel demand – even after socioeconomic differences are controlled for – typically find expression through age (younger), birth rates (higher), driving licence penetration (lower), vehicle usage (lower), transit usage (higher) and residential location (clustered); certainly in the short-medium term.
Traffic consultants have downplayed the sources, role and significance of predictive uncertainty in their forecasting models for too long. This now needs addressing head-on
The issue of the uncertainty associated with population forecasts is discussed later. However, immigration assumptions themselves introduce uncertainty. Immigration rates and representation from different countries of origin depend on political and economic conditions in the host jurisdiction (and overseas) as well as legislation limiting or extending entry. And as we appear to be witnessing under a Trump administration, these conditions may be subject to change over time.
The take-away from the above is an analytical requirement to dig deeply into any population projections to understand the drivers of growth. Identical population growth rates could have very different travel demand implications depending on the components of that growth.
Unfortunately, the question ‘where?’ turns out to be even more problematic, as population growth is seldom uniform by location. Conventional traffic models aggregate individual travel demand into basic geographical units or zones; Traffic Analysis Zones (TAZs). These zones are relatively small. The challenge is therefore twofold: first, to correctly forecast population growth; and, second, to allocate it to the correct zones; bearing in mind that the size, shape and connectivity of these zones will themselves influence the results from a traffic forecasting model.
In this context, future population densities can start to impact on travel demand. Increases in density (for example urbanisation) beyond certain thresholds improve transit viability and are often accompanied by a reduced dependency on cars. Litman and Steele (2013) suggest that a doubling of population density in the US reduces vehicle miles travelled (VMT) by 4-12 per cent, findings that concur with an earlier report from the Transportation Research Board.
Finally, it goes without saying that – all things being equal – future population growth in zones that lie some distance away from a transportation asset is unlikely to result in much uplift in demand. So not only do we need to understand the components of population growth, we also need to understand its spatial distribution and the implications thereof.
To examine the uncertainties associated with population forecasts and how these can impact on travel demand, I conducted a meta-analysis of the literature, and reviewed detailed population data underpinning a toll road study I was currently reviewing. The literature review focused on US research and the detailed examination looked at the State of Virginia. My sources simply reflected the dominance of American researchers in this field and the availability of data. The overall findings, however, appear to be capable of generalisation.
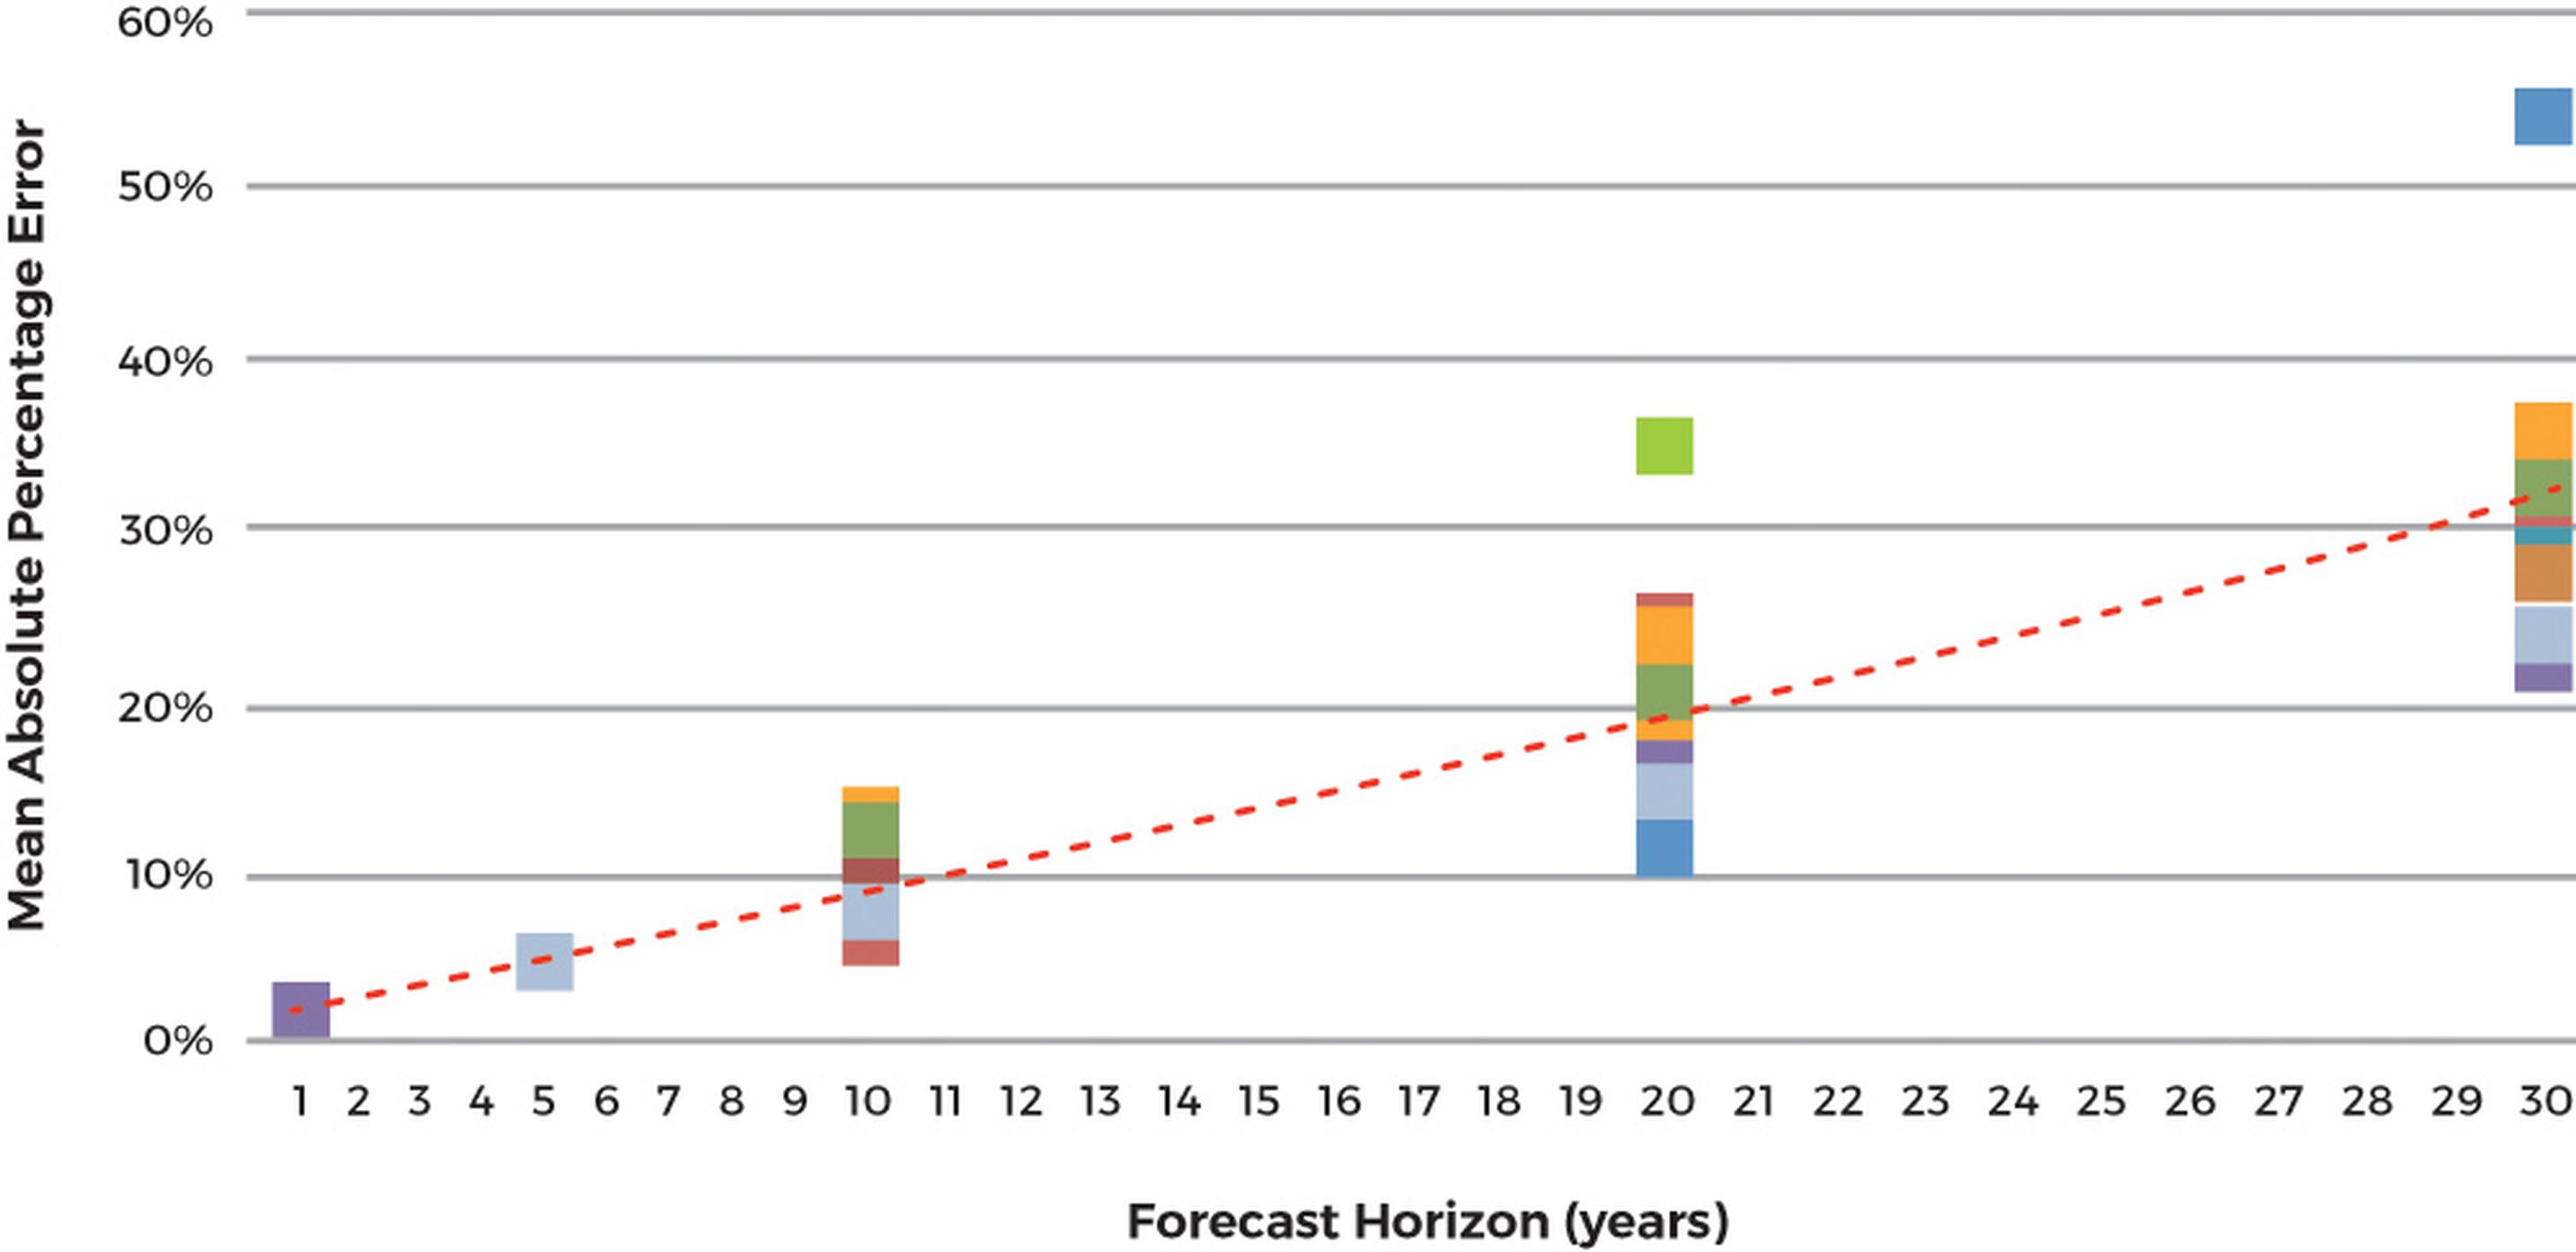
First I looked at forecasting errors at the ‘small area’ level (equivalent to US counties) and their association with the passage of time. This was the focus for my meta-analysis which compared past forecasts with outturn data, usually at 5 or 10-year intervals. The findings (errors) are summarised in Figure 1 with a trend fitted through the mid-points. Different data points represent different studies and a clear pattern emerges. In accordance with intuition, forecasting error - measured here by mean absolute percentage error - increases as the forecasting horizon lengthens. The forecasting errors summarised in Figure 1 are not insignificant; the trend-line increasing at a (slightly) increasing rate. Twenty or 30-year population forecasts are commonly used in transportation studies by which time errors of ±25% to ±35% are observed at the county level. This prompted my second line of research. How do population forecasting errors vary, not in time but by size of the spatial unit under investigation?
A number of geographers have pointed out that, although population forecasting may be relatively accurate at a national level (notwithstanding issues with immigration and the passage-of-time findings highlighted earlier), accuracy rapidly deteriorates as the area under investigation contracts. This aligns with statistical theory which demonstrates that sampling error increases as the sample size decreases.
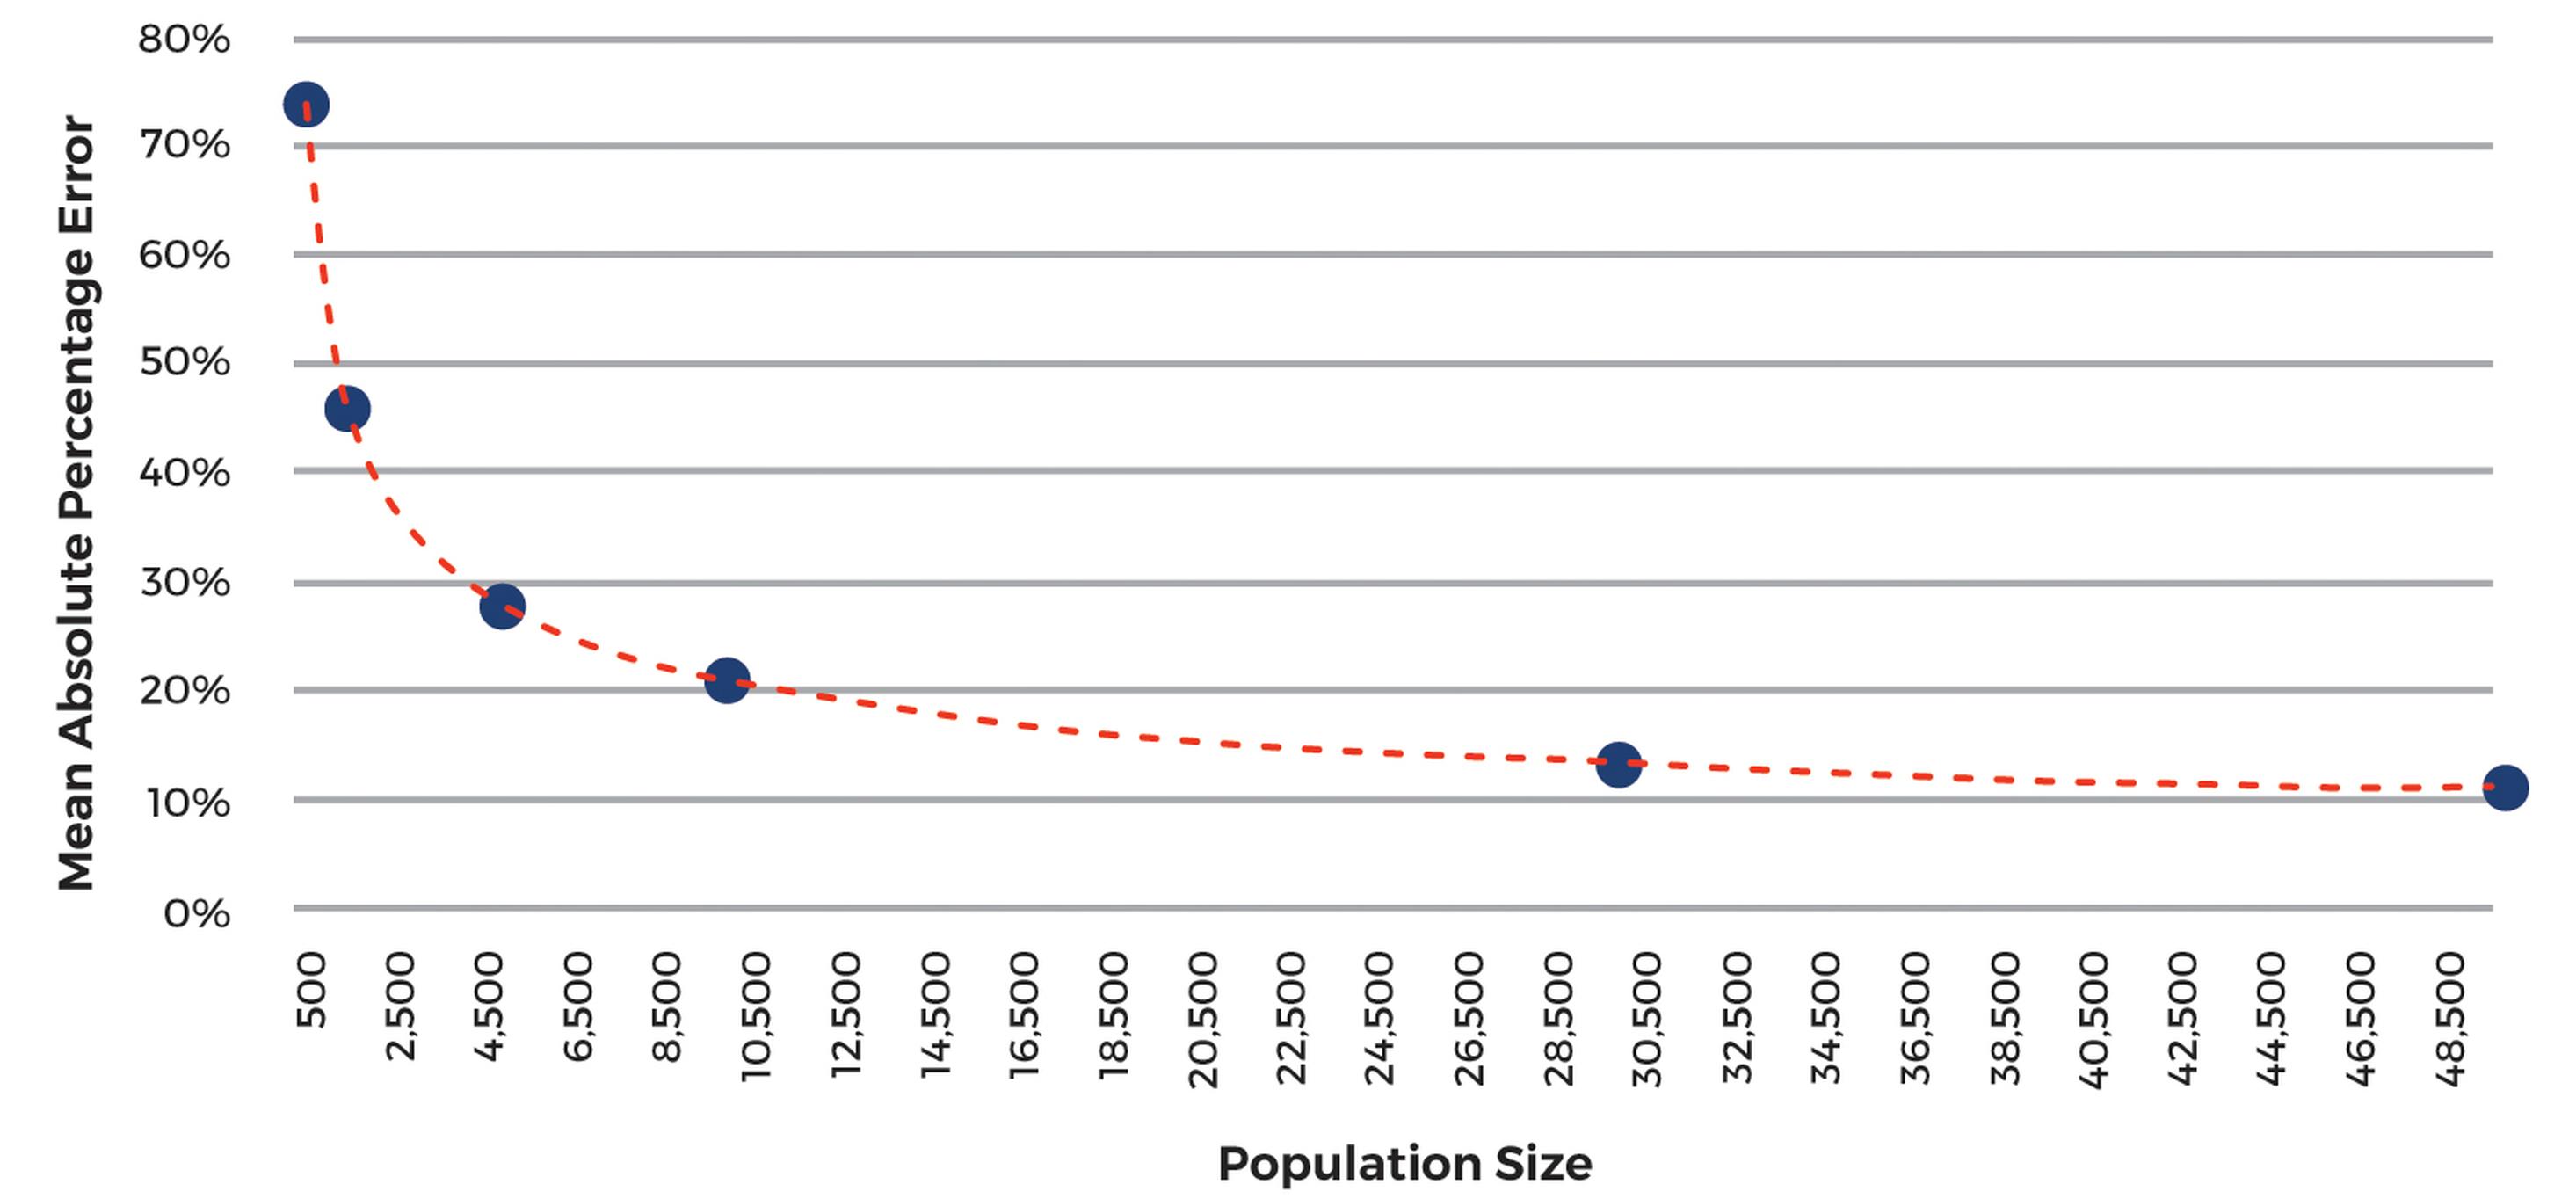
This phenomenon is nicely illustrated in Tayman et al (1998), wherein the authors examine the role of population size in the determination of population forecasting errors (see Figure 2 for average errors at Year 10). Consistent findings are reported by others.
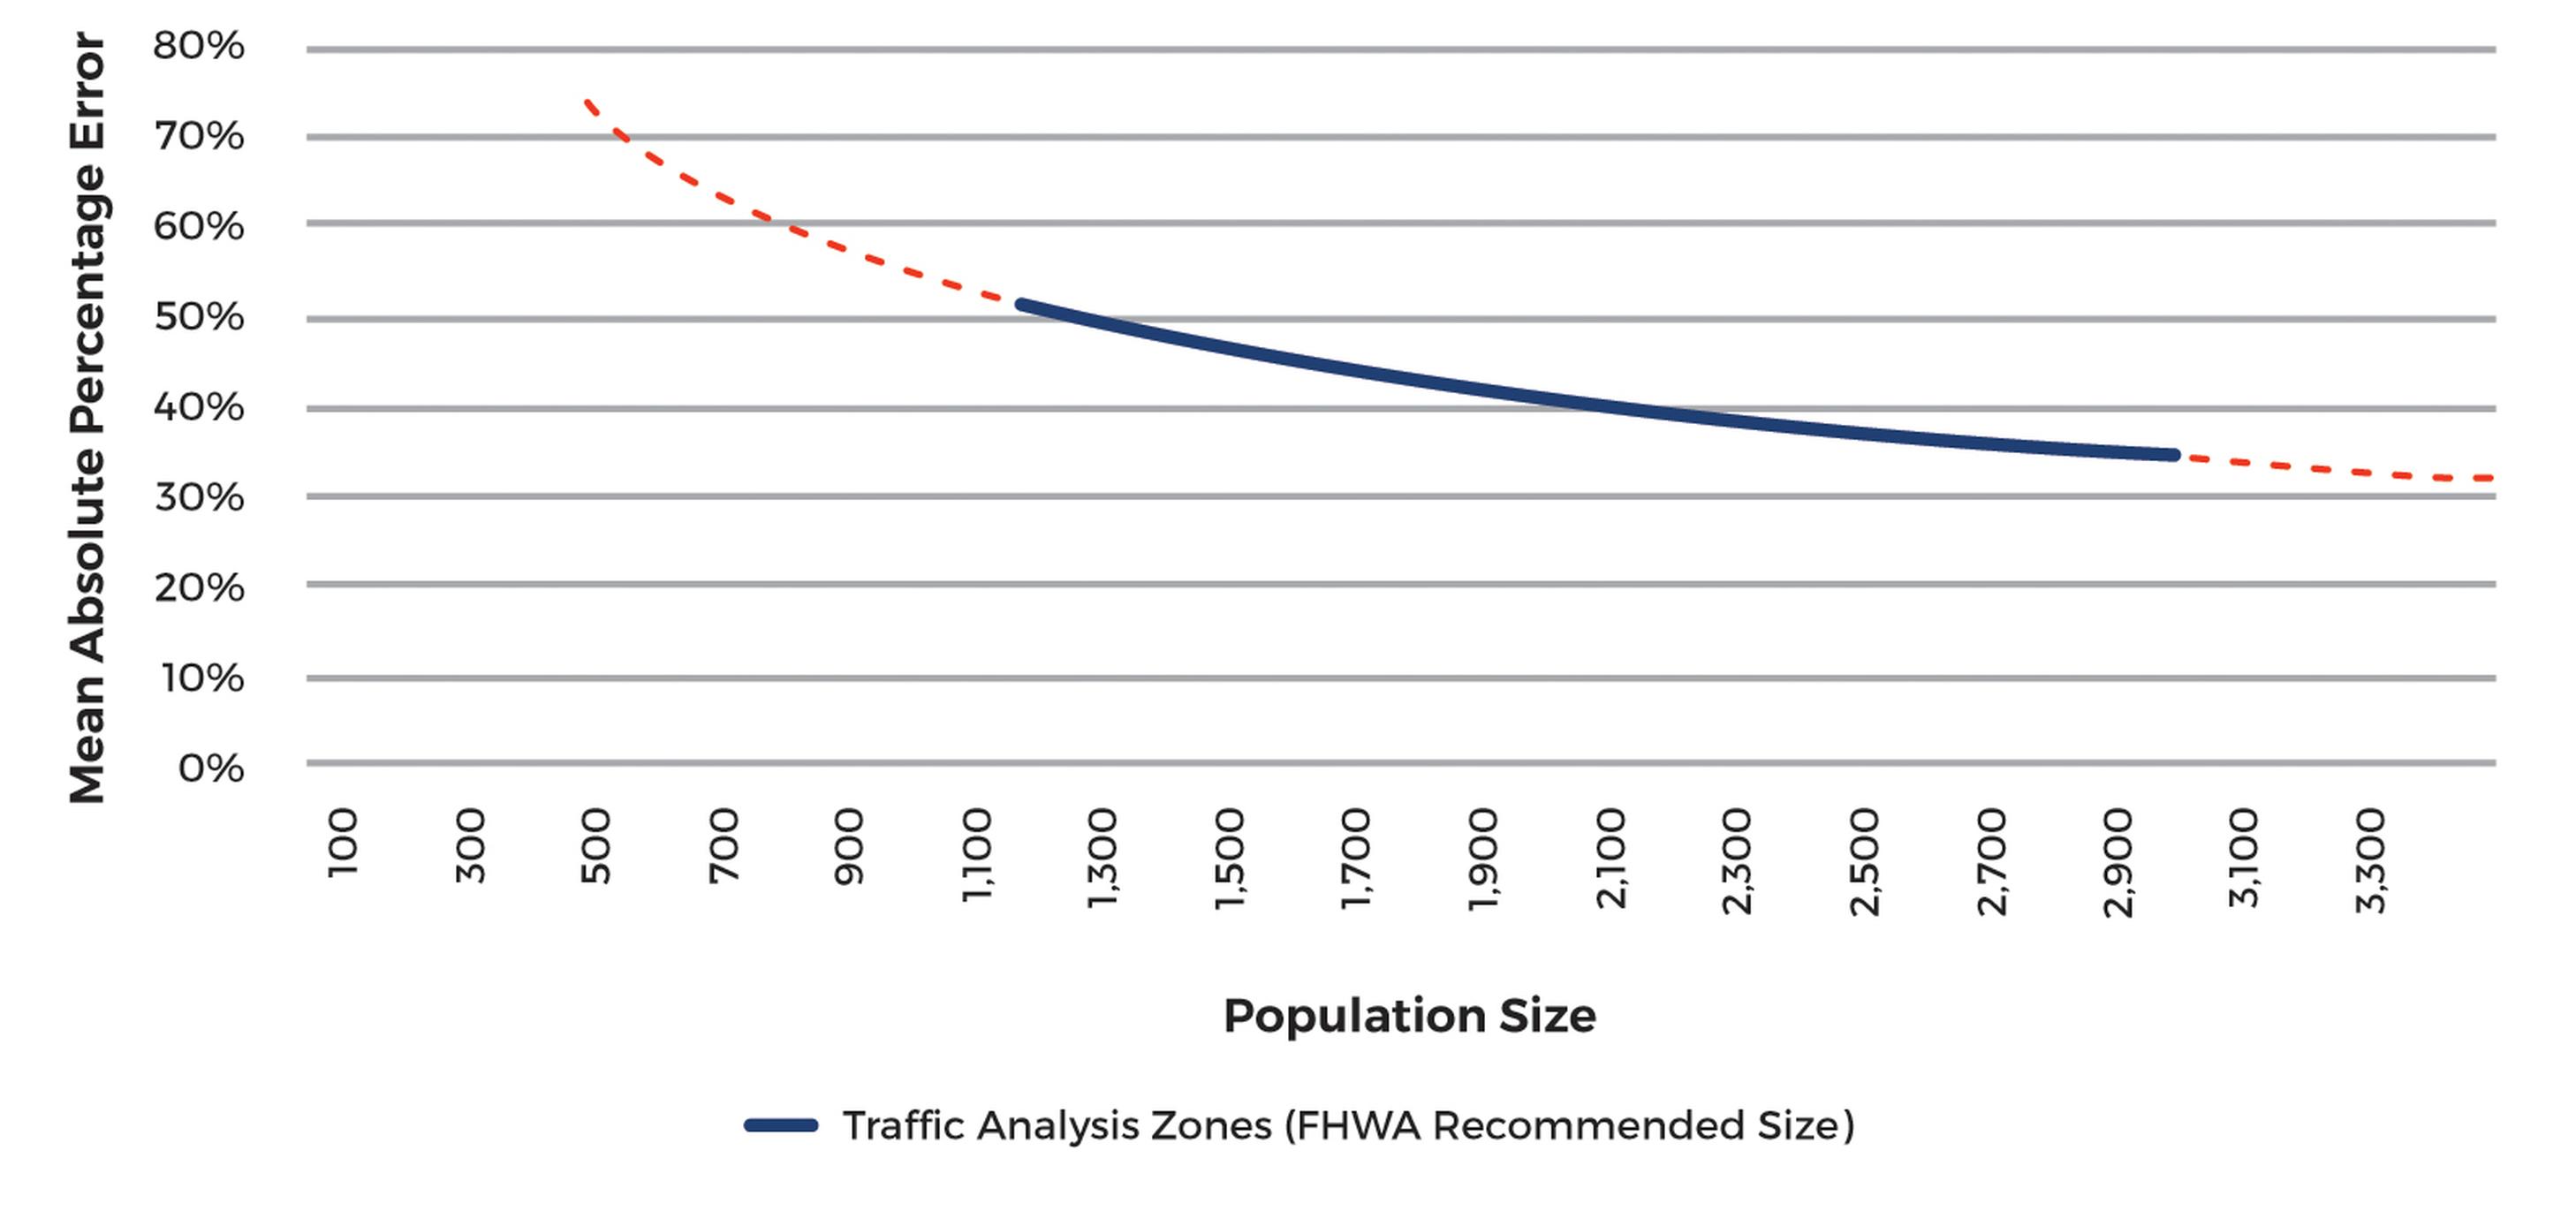
Tayman’s data highlights the nature of the relationship between forecasting error and population size. As population size decreases, forecasting errors increase at an increasing rate. However the scale on the horizontal axis in Figure 2 is considerably larger than the typical sizes of Traffic Analysis Zones. Figure 3 re-scales the graph showing the Federal Highway Administration recommended range for transportation models: 1,200-3,000 people/zone. There are two key take-aways from Figure 3:
The research presented so far has looked backward, comparing population forecasts made some time ago with observed outcomes. It is also possible to look forward. Although the outcome cannot (yet) be observed, the differences between population projections made by different (big-name) forecasters for the same areas is instructive. For this analysis I looked at 2040 population projections made for the State of Virginia concurrently by Woods & Poole and Weldon Cooper. The findings were generally consistent with those reported earlier.
At the state level, the projections for 2040 differed by around 11 per cent. This increased to 22 per cent for regional forecasts and anywhere up to 148 per cent at the individual county level. However US counties are large. The average population/county lies at around 150,000 people; much bigger than Traffic Analysis Zones. This sounds a stark warning about simply taking zonal population projections as a ‘given’ without interrogating and understanding them first. Some of the differences derive legitimately from alternative definitions, measurements, data, methodologies and models used by different demographic forecasters. In the absence of any detailed investigation, however, such facts would remain hidden from the users of their forecasts.
The consensus view is that vehicle ownership in many OECD countries has reached (or is certainly approaching) saturation levels. Vehicle ownership and usage per capita is not expected to increase much further. In terms of traffic growth, this places increased dependency on population growth. Understanding population growth in some detail therefore moves centre-stage in terms of commercial due diligence. A number of conclusions can be drawn from the research discussed in this article. Each has important implications for infrastructure investors:
1. Understanding the components of and contributors to population growth is critical, as different population cohorts exert different influences on travel demand.
2. Understanding the spatial distribution of population growth is vital. Population growth is rarely evenly distributed and densities can become important future considerations, not only in terms of the locational impact on demand per se, but in terms of mode dependency, availability and choice.
3. There is a rich seam of research and literature focused on population projections and predictive accuracy which should be reflected in any transportation study that places reliance on population as an explanatory variable.
4. The errors and uncertainty associated with population projections are significant and increase with time.
5. The errors and uncertainty associated with population projections are significant and increase as the spatial unit under examination contracts in size.
6. The distributional characteristics of population projection errors appear to be stable over time. Past errors can therefore be used to estimate confidence intervals which, in turn, can be employed by practitioners (such as traffic forecasters).
7. In travel demand studies, long-range population projections are required for small zones. These twin requirements combine to exacerbate input variable uncertainty and increase the potential for transportation forecasting errors.
8. The error and uncertainty associated with other important explanatory variables may be even greater than described here. Employment forecasts are also used in many travel demand studies - modelling commuting patterns, for example - yet research suggests that these inputs are even less reliable than population projections.
Traffic consultants have downplayed the sources, role and significance of predictive uncertainty in their forecasting models for too long. The topic needs to be addressed head-on, if not by the forecasting community itself, then by pushy, inquisitive investment analysts.
In terms of interpreting and using traffic forecasts, the reasonableness and reliability of population projections needs to be tested at the local level. And the issue of input uncertainty should be communicated to investment decision-makers in ways that suggest how risk exposure can be both intelligently understood and effectively managed. In short, infrastructure investors need to become smarter consumers.
Robert Bain runs RBconsult (www.robbain.com) and is a Visiting Research Fellow at the University of Leeds
Editor’s note:This article was originally written for an international audience of infrastructure investors. We republish it here as it has important implications in terms of demand forecasting and predictive reliability. It also switches attention from the producers to the consumers of forecasts, providing a different perspective from most transport forecasting literature.
TransportXtra is part of Landor LINKS
![]()
© 2026 TransportXtra | Landor LINKS Ltd | All Rights Reserved
Subscriptions, Magazines & Online Access Enquires
[Frequently Asked Questions]
Email: subs.ltt@landor.co.uk | Tel: +44 (0) 20 7091 7959
Shop & Accounts Enquires
Email: accounts@landor.co.uk | Tel: +44 (0) 20 7091 7855
Advertising Sales & Recruitment Enquires
Email: daniel@landor.co.uk | Tel: +44 (0) 20 7091 7861
Events & Conference Enquires
Email: conferences@landor.co.uk | Tel: +44 (0) 20 7091 7865
Press Releases & Editorial Enquires
Email: info@transportxtra.com | Tel: +44 (0) 20 7091 7875
Privacy Policy | Terms and Conditions | Advertise
Web design london by Brainiac Media 2020