In the Middle East, when new suburban areas are developed on public land, the road infrastructure must be developed within the available right-of-way and in coordination with a large number of stakeholders. As a result of this process, many compromises take place, leaving road users without a voice. Today, the driver’s experience is looked at primarily from a congestion and road safety point of view on an individual road segment and junction basis. Such analysis does not reflect the level of frustration or enjoyment a driver experiences. Based on existing VISUM models, we show how it’s possible to take driver experience into account, potentially leading to a more user-centric design process.
A variety of emotions can be experienced on the road. Well-designed, brand new residential road networks can still generate strong negative feedback. Based on available literature, three broad categories of factors strongly influence a driver’s experience, and our interpretation of these factors for residential roads is:
Practical factors relates to how direct and quick is the access to the Principal Road Network towards the desired destination;
Emotional and stress factors relates to how pleasant / stressful is the driving experience, and;
Cognitive factors relates to how easy it is to drive the vehicle, for the driver to find their way, and to change destination during their trip, whether as a linked trip or to avoid traffic congestion.
On a generously designed modern street network, complaints from residents could be interpreted as the desire for a better alternative route choice. Design standards and Road Safety Audits mostly address the potential information overload a driver might experience while driving, but on a location by location basis, not as a journey. Driving is therefore expected to be easy from a handling point of view, but it is still possible to experience frustration as a result of being forced to use convoluted and un-intuitive routes.
Our approach has been to use a typical strategic transport model, in this case VISUM, with minimum modifications to extract the relevant data needed to quantify a driver’s experience:
Zoning system disaggregation: This ‘Driver Experience’ analysis takes the point of view of a local resident. The inherited zoning system from the strategic model typically corresponds to a group of neighbourhood blocks, which is too coarse for our purpose. However, through the development of an Excel-based VBA macro, the zoning system can be disaggregated so that each segment of street is assigned an individual zone (external zones were unaltered). This approach enables statistics to be gathered for each path between a particular street segment and an external zone.
O-D matrix and assignment: A shortest path assignment method using a seed matrix has then been run to enable the extraction of path statistics (incremental assignment with 100% demand assigned at first step).
The following data has been extracted from the VISUM database of PrT Paths:
Direct and path distance
Number of junctions traversed
Number of turns by type (u-turns, left, right and thru)
Travel time spend on local and collector network to access the principal network
Delay at junctions
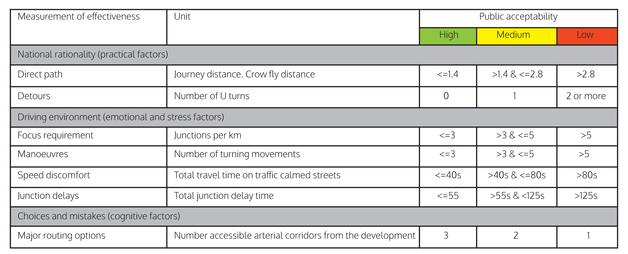
Each of the statistics extracted from the VISUM database were compiled into Measures of Effectiveness (MoE) as provided in Table 1. The threshold values for each of the MoE’s are empirical and are based on available literature and our understanding of local expectations.
For each local street, driver’s experience has been calculated using a point system or ‘Driver Experience Indicator (DEI)’. For each Measure of Effectiveness, the score allocation has been identified as follows:
“2” score if the worst mark is High across all paths;
“1” score if the worst mark is Medium across all path, and;
“0” score if the worst mark is Low across all path.
In terms of the overall street scoring for the Driver Experience Indicator (DEI) this has been defined as:
Very poor experience (DEI of 3 or below);
Poor experience (DEI equal to 4);
Typical experience (DEI between 5 and 6), and;
Good experience (DEI of 7 or more).
We have tested the implementation of three types of design alternatives in an attempt to improve Driver Experience for our network:
The removal of the median on a 40m Right-of-Way corridor;
The replacement of a Right-in Right-out by a full movement junction, and;
The opening of a cul de sac to Arterial Corridors by Right-in Right-out connections.
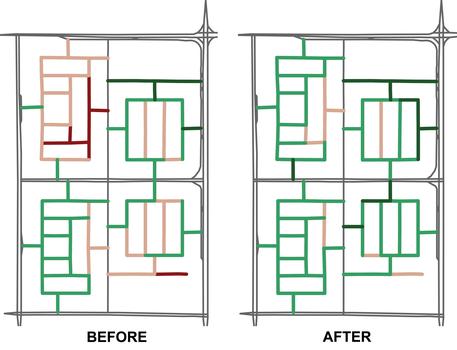
Map 1 illustrates graphically the Driver Experience impact of changing key junctions from right-in right-out into full movement traffic signals.
In conclusion, this work demonstrates that it is possible to take driver experience into account during Traffic Studies and Concept Design Stage using existing modelling tools. The selection of individual statistics as well as Public Acceptability benchmarked values require to be refined. Survey methods are available to quantify local driver experience, this will help us adjusting Public Acceptability criteria.
David Carrignon, Associate Technical Director (Traffic) ARCADIS, Qatar, and
Vijit Vijayan, Senior Modelling Specialist, ARCADIS, Qatar
TransportXtra is part of Landor LINKS
![]()
© 2026 TransportXtra | Landor LINKS Ltd | All Rights Reserved
Subscriptions, Magazines & Online Access Enquires
[Frequently Asked Questions]
Email: subs.ltt@landor.co.uk | Tel: +44 (0) 20 7091 7959
Shop & Accounts Enquires
Email: accounts@landor.co.uk | Tel: +44 (0) 20 7091 7855
Advertising Sales & Recruitment Enquires
Email: daniel@landor.co.uk | Tel: +44 (0) 20 7091 7861
Events & Conference Enquires
Email: conferences@landor.co.uk | Tel: +44 (0) 20 7091 7865
Press Releases & Editorial Enquires
Email: info@transportxtra.com | Tel: +44 (0) 20 7091 7875
Privacy Policy | Terms and Conditions | Advertise
Web design london by Brainiac Media 2020