Much is known about the relative costs of building and operating BRT and LRT, and some of this evidence has been published before by BRTuk; by and large BRT is cheaper to build and to operate than LRT. However less is known about how passengers perceive the two systems, and whether they see one as superior to the other.
This issue often arises in discussion with cities here and abroad that are considering whether to invest in one of the two systems. Typically they would like to build LRT but can only afford BRT, and are worried that BRT will be less acceptable to potential users.
Steer Davies Gleave runs an internally funded research and innovation (R&I) programme that provides the opportunity to investigate issues like this. In 2011 an R&I project was set up to investigate the preferences of users of BRT and LRT in Nantes, a city where both systems are in operation. This gave us the opportunity to talk to people with experience of both systems and to explore how, in their view, they compared.
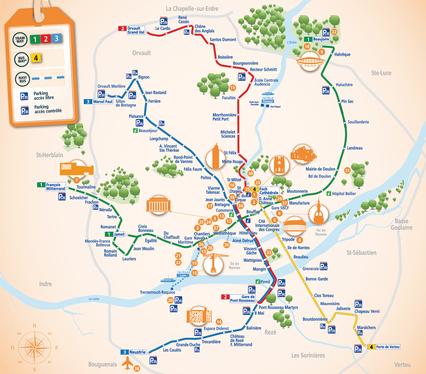
Nantes is a regional capital in the west of France, with a population of 290,000. The city’s tram system, known as Tramway, was re-opened in 1985 after reconstruction work and, following a series of extensions, now consists of three lines with a total track length of 41.4km.
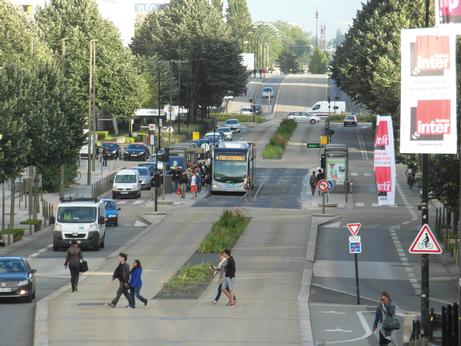
In November 2006 a BRT line was opened, under the name Busway, operating from Porte de Vertou in the south east to Foch Cathédrale in the city centre, a distance of seven kilometres. For much of its length the busway operates on dedicated lanes in the centre of the road.
The aim of the research was to assess how users rated the two modes of transport relative to each other, and to identify which factors contributed to the differences and by how much. This was done using a mix of qualitative and quantitative research. The primary method was a programme of face-to-face interviews with users to ask them in detail how they perceived the two services, and to measure, using stated preference techniques, how strong those preferences were. There was potentially a long list of factors that might affect users’ perceptions of one service versus the other, so this interview stage was preceded by focus groups with experienced users in which we explored their perceptions of the two services and developed a list of the factors that appeared to distinguish most significantly between Tramway and Busway. These factors were then tested more fully in the interview programme.
People in the focus groups were positive about both Tramway and Busway but by and large the groups liked Busway more than the tram. Common themes were that it was very comfortable, clean, had good clear information on-board, offered a fast, smooth journey with less risk of accidents, and was generally thought to be a newer and more modern mode of transport. Of course, Busway is the newest of the services, and so was likely to have a higher rating on attributes related to newness.
The main area where Busway did less well was on the extent of the network, which with only one line is less extensive than Tramway. There were also some suggestions that the buses in operation were too small or over-crowded, while there was a perception that service frequency was better on Tramway than on Busway.
Consequently Tramway scored well on service levels, because of its three lines, but also because it has interchanges with the other tram/bus lines, the TER/TGV, the Bicloo cycle hire network, the Navibus and many of the local bus services that serve the city. People also liked the frequency of the services and the high capacity of the trams compared to the busway.
The focus groups generated a list of attributes that contributed to the differences users perceived between Tramway and Busway. This list was then used to design a questionnaire for the next phase, carried out with a larger sample.
The stated preference research
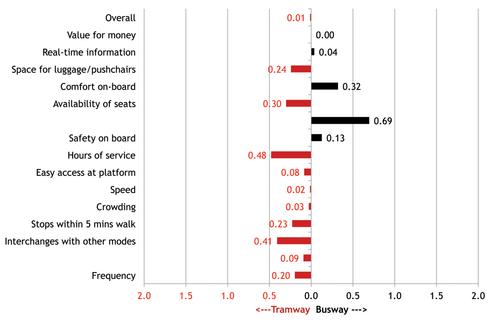
Face-to-face interviews were carried out with 515 people who had recent experience of using Tramway and Busway. The questionnaire began by exploring the list of service attributes that had been identified in the focus groups, asking people to rate the relative performance of each system against each attribute on a five point scale. As expected, Tramway did better on the service level attributes, while Busway was better on comfort, cleanliness and, marginally, safety. Overall, Tramway was rated better than Busway.
The differences are narrower when we look only at people who use both modes frequently. The overall preference is virtually zero, and while Tramway is still preferred on the service level attributes and Busway on comfort, the magnitudes of the scores are mostly reduced.
The stated preference questions were designed to measure strength of preference for one mode versus another, expressing the results in monetary values. A very simple SP might show that Busway, say, was preferred to Tramway to the value of so many cents per one-way trip, but our intention was to break down the overall preference among the service level attributes, to measure how much they contributed to the overall preference.
There were too many attributes to treat them all individually in an SP exercise, but it was clear from the focus groups that there were two broad classes of attribute that differentiated between Busway and Tramway. They were:
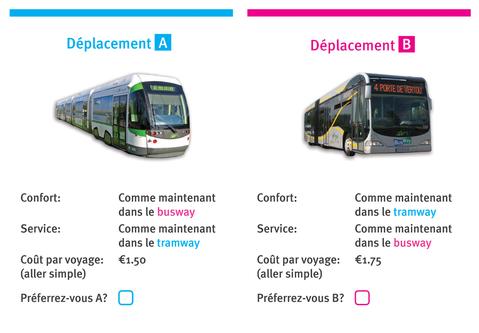
SP poses a series of realistic but hypothetical choices, carefully constructed so that by using statistical modelling later it is possible to deduce how much influence each attribute has on the choices people make. In this case respondents were offered choices between alternative ways of undertaking a recent, actual, trip, using Busway or Tramway, each with the compound attributes at one of two levels: as experienced now on the trams, or as experienced now on the Busway. Each trip also had a fare attached.
In this example the respondent is being asked to choose between the tram, on the left, with comfort levels as currently experienced on Busway, but with a service network as currently offered by the tram, and at a one-way fare of €1.50, and, on the right, Busway, with comfort levels as currently experienced on the tram, but with the current Busway service network and a one-way fare of €1.75. Each respondent was asked to make a series of such choices, with comfort, service levels and fares varying in each case.
This structure allows us to measure the preference people have for Busway relative to Tramway, while capturing how much the different levels of comfort and service level contribute to that preference. Because money was also included in the choice tasks it was possible to express the strengths of preference in monetary terms, as Euros per trip.
The finding was that the overall preference was for Tramway over Busway, to a value of eight cents per one-way trip. This is consistent with the overall rating scale. In addition:
So if Busway’s service network was as extensive as Tramway’s, this would reduce the overall preference for Tramway from €0.08 per trip to €0.08 - €0.28 = -€0.20. This is negative, indicating that Busway is now the preferred mode.
If it was then possible to improve the overall comfort levels on Tramway to be the same as Busway, this would increase the overall preference back towards Tramway, changing it to €0.08 - €0.28 + €0.08 = -€0.12. This is still negative; the preference for Busway is reduced, but is still there.
This pattern was consistent when different types of passenger were examined: there was an overall preference for tram, but this was largely due to the better network coverage, and when this was taken into account the residual preference was for Busway over tram. Even when Busway’s better comfort level was allowed for there was still a residual preference for Busway.
What this means
Of course, these findings are specific to Nantes, deriving from the services implemented there and the views of the local population and their attitudes towards public transport. In detail they may not be transferable elsewhere. However what can be said is that in general there is no reason to suppose that BRT is innately inferior to tram. On the contrary, the research shows that a well-designed and operated BRT system can be at least as attractive to passengers as tram, if not more so.
LTT, jointly with BRTuk presents:
23 Sep 2013 to 24 Sep 2013
2 Day Event
Launch and Study Tour: Luton Dunstable Busway
National and International Experience
Privileged updates on UK schemes
Exceptional Networking
TransportXtra is part of Landor LINKS
![]()
© 2026 TransportXtra | Landor LINKS Ltd | All Rights Reserved
Subscriptions, Magazines & Online Access Enquires
[Frequently Asked Questions]
Email: subs.ltt@landor.co.uk | Tel: +44 (0) 20 7091 7959
Shop & Accounts Enquires
Email: accounts@landor.co.uk | Tel: +44 (0) 20 7091 7855
Advertising Sales & Recruitment Enquires
Email: daniel@landor.co.uk | Tel: +44 (0) 20 7091 7861
Events & Conference Enquires
Email: conferences@landor.co.uk | Tel: +44 (0) 20 7091 7865
Press Releases & Editorial Enquires
Email: info@transportxtra.com | Tel: +44 (0) 20 7091 7875
Privacy Policy | Terms and Conditions | Advertise
Web design london by Brainiac Media 2020