Sydney is Australia’s largest and most densely populated city, with a population of 4.6 million. The city’s central business district (CBD) covers an area of approximately 2 square miles, is bounded on two sides by water and contains 32 million square metres of floor space. More than 180,000 people live in the city of Sydney, sharing the space with about 20,000 businesses. Every day approximately 400,000 people arrive to work in this area, and another 500,000 travel to the city for shopping, education, business or entertainment.
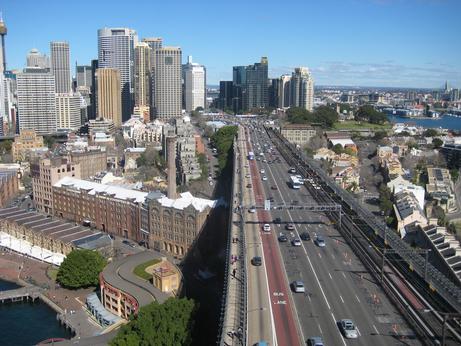
Access from the north is constrained by capacity on the Sydney Harbour Bridge and a parallel tunnel. The bridge has eight traffic lanes and operates a tidal flow system on the central three lanes. All public transport crosses by the bridge, which has a single dedicated bus lane and two train lines. The train network north of the harbour is not extensive; buses are the only public transport option from most northern suburbs. Approximately 2,000 buses cross the bridge during the morning peak. All these buses stop in or near an area at the north end of the CBD, around Wynyard Park.
This area is busy now, and it will get busier: a major new extension of the city centre, Barangaroo, immediately to the west of Wynyard, has already been approved. The new precinct will be a hub for the financial services sector and will also include apartments, a major hotel, shops and restaurants as well as cultural venues. The site will eventually cater for 23,000 workers and around 2,000 residents. A key issue in this area is a shortage of capacity for disembarkation. In the morning peak the queue of buses waiting to offload passengers can extend back across the bridge; there may be 50 or more buses waiting at any one time. Encouraging commuters to use public transport relies on the customer experience, and being stuck in your bus when you can see your destination is not a good experience, and will often have you reaching for your car keys.
Nanosimulation is a software analysis technique that can quantify the economic benefit of a transport network design by modelling the people travelling within that network, as well as the vehicles that carry them. The people may be driving, or walking, or cycling, or be passengers on a train or a bus or in a taxi. Following each one from person-origin to person-destination records the total cost of the trip, not just one part. Measurement of the total trip cost allows better assessment of the potential benefit of new or modified designs.
Nanosimulation person-trip models are more detailed than their microsimulation vehicle-trip counterparts; the two technologies are complementary rather than directly competitive. A typical nanosimulation model might cover an area of 2-5 square kilometres, whereas a typical microsimulation model is perhaps five to ten times larger. One of the key differences with nanosimulation is that it allows the assessment of options using person-based measures. In addition to using total vehicle-kilometres and vehicle-hours of travel (VKT and VHT) the modeller can extract person-kilometres and person-hours (PKT and PHT). Importantly, these measures include time and distance for each individual over all modes used for the journey.
Many person trips include a pedestrian component. For nanosimulation, it is important that this component is ‘joined-up’, and is linked to any connected private car or public transport vehicle component. Assuming that linkage exists, the pedestrian network must be modelled in detail, in order that the time and distance measured for the pedestrian component are accurate. Commuter supports many different types of links, enabling the construction of a realistic pedestrian network. These links include controlled and uncontrolled crossings, stairs, ramps, lifts and escalators, and take into account the delays that might be experienced at gates, barriers or checkpoints. Accessibility issues can also be addressed by highlighting network connectivity for particular modes, for example where stairs cannot be used. Each pedestrian agent in a nanosimulation model calculates its own route through the network, according to the costs for each link; if a particular destination cannot be reached this will be highlighted in the model. Different types of cyclists may also be modelled, and the model can represent shared paths where cyclists interact with pedestrian traffic.
An often-ignored piece of the modelling puzzle is parking. Every car trip starts and ends with parking. Nanosimulation software models on-street and off-street parking, incorporating the time to search for a free parking bay into the total travel time. In an assessment of park-and-ride, for example, the PHT measure includes this search time and the time to walk from the parking bay to the train platform, and the waiting time for the next train. This additional time may make the difference between go and no-go when added to the travel time by car and by train that might be the only times modelled by higher-level models.
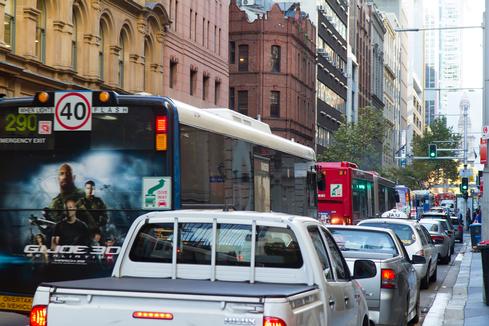
In Sydney’s CBD, like many cities, a surprising proportion of vehicle traffic is circulating in the congestion while the driver searches for that elusive free parking bay. Empty taxis looking for fares add to this destination-free traffic. Any accurate model must include that circulating traffic because, in a system that is operating at very close to capacity, this ‘traffic going nowhere’ may be the straw that breaks the camel’s back.
The Sydney Northern CBD model is bounded to the west by the Western Distributor and Barangaroo Foreshore, to the east by Macquarie Street and to the south by Bathurst Street. The simulation runs from 05:00 to 19:00 hours, covering the weekday peaks and business hours. The modes of travel included are cars, buses, taxis, pedestrians, cycles, light rail and service vehicles.
The commission involved modelling various change option scenarios and assessment of their impact on the Sydney Northern CBD. The options include ways to manage existing and future congestion in the area with improvements to public transport and changes to lane use.
Part of the commission is an investigation into diverting some bus service routes from busy streets to reduce congestion, assessing the full implications to the bus service users as well as private vehicles. Other scenarios include the assessment of various lane use options including changes to bus lanes, on-street parking and bus stop locations. Light rail in George Street, the main road connecting the Northern CBD to the Southern CBD, is another option to be assessed. This option redistributes buses and traffic to other parts of the northern CBD.
The proposed option scenarios will impact on the congestion levels within the Northern CBD directly affecting journey times for all commuters. Encouraging public transport use is key to reducing congestion, hence detailed assessments of the public transport measures in terms of revised wait times, ride times and transfer times for bus to bus and bus to light rail are essential.
Bus and light rail capacity can be modelled, hence the wait time experienced by a person in the model is recorded as the time until a vehicle with spare capacity arrives and the person boards. The public transport vehicle dwell time is based on the number of people boarding and alighting.
The model produces all standard results including journey time and distance analysis for every person disaggregated by mode. Public transport information including wait time at all public transport stops and the number of passengers boarding and alighting is also recorded. It is possible to track people as passengers on any bus service, and follow each one through any change onto another service. All this information can be used to assess the impact of the modelled scenario options for all commuters to the Northern CBD.
In June 2013 the project is still in progress but some quick wins have already been identified. As an example, re-configuration of the signal control at some key intersections has already been implemented, taking into account pedestrian, bus, and general traffic phases. This resulted in a net reduction in person-trip time and a better clearance rate of buses from the congested area.
Double-decker buses have also been re-introduced after 25 years of absence. These can carry more people and the routes they service have been diverted to stands where dwell time is less of an issue.
Sydney city centre will always be busy but there is a renewed focus on people, across all aspects of planning, including modelling. This renewed focus on how people access and use the city aims to ensure that busy means bustling, not busted.
TransportXtra is part of Landor LINKS
![]()
© 2026 TransportXtra | Landor LINKS Ltd | All Rights Reserved
Subscriptions, Magazines & Online Access Enquires
[Frequently Asked Questions]
Email: subs.ltt@landor.co.uk | Tel: +44 (0) 20 7091 7959
Shop & Accounts Enquires
Email: accounts@landor.co.uk | Tel: +44 (0) 20 7091 7855
Advertising Sales & Recruitment Enquires
Email: daniel@landor.co.uk | Tel: +44 (0) 20 7091 7861
Events & Conference Enquires
Email: conferences@landor.co.uk | Tel: +44 (0) 20 7091 7865
Press Releases & Editorial Enquires
Email: info@transportxtra.com | Tel: +44 (0) 20 7091 7875
Privacy Policy | Terms and Conditions | Advertise
Web design london by Brainiac Media 2020