
It’s easy to stereotype different generations; changing values and different levels of comfort with technology often create the sense that there is a growing gulf between old and young. Much has been made of the age-related factors in the Brexit vote, for example. But is your generation really that different from that of your parents (other than in spending an inordinate amount of time on social media)? Is there value in understanding generational factors? And what applications might this have to transport modelling?
Since the 1960s, researchers working with social phenomena have become increasingly interested in cohort effects. The basic idea is that while at an individual level everyone is different, the context and shared experiences of a generation (or ‘cohort’) can have long-lasting effects on that generation’s values, preferences, belief systems and ultimately behaviours. What’s of interest is whether a cohort’s response to their shared experience can prompt trends that persist through their lifetime.
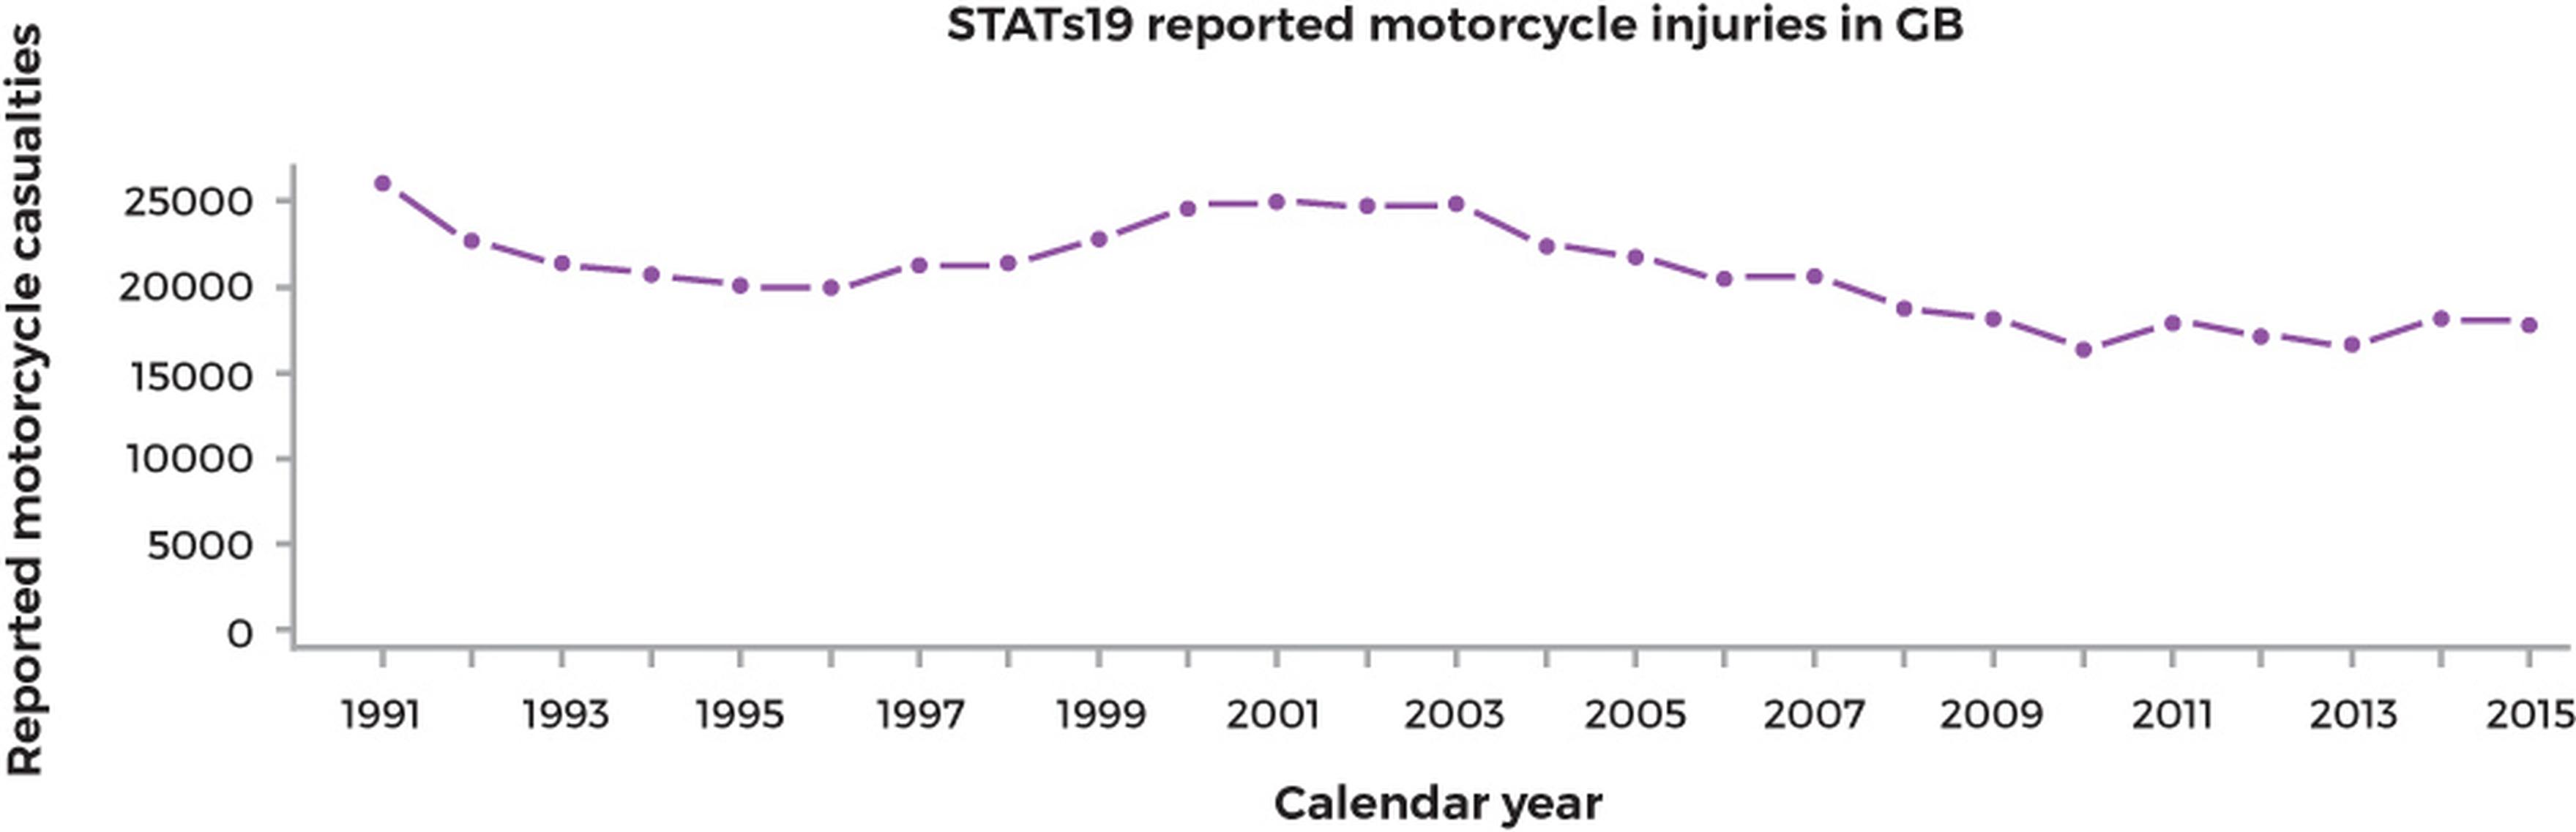
The following example shows how a different conclusion could be drawn from accident data through the application of three different approaches: a standard analysis, a modelling approach and a cohort visualisation. Figure 1 shows a conventional time series plot of the reported male motorcycle casualties in Great Britain, taken from widely-available STATs 19 collision data. Your first inclination might be to draw a line of best fit and conclude that casualties are exhibiting a long-term downward trend. The limitations of this approach are that it makes no adjustment for population numbers, aggregates all cohorts within a single number, and makes no adjustment for the amount of motorcycling each group actually does.
While modelling for reasons of interpretation may well be challenging, age-period-cohort models have been very widely used when forecasting disease burden into the future. The same techniques can be used in transportation
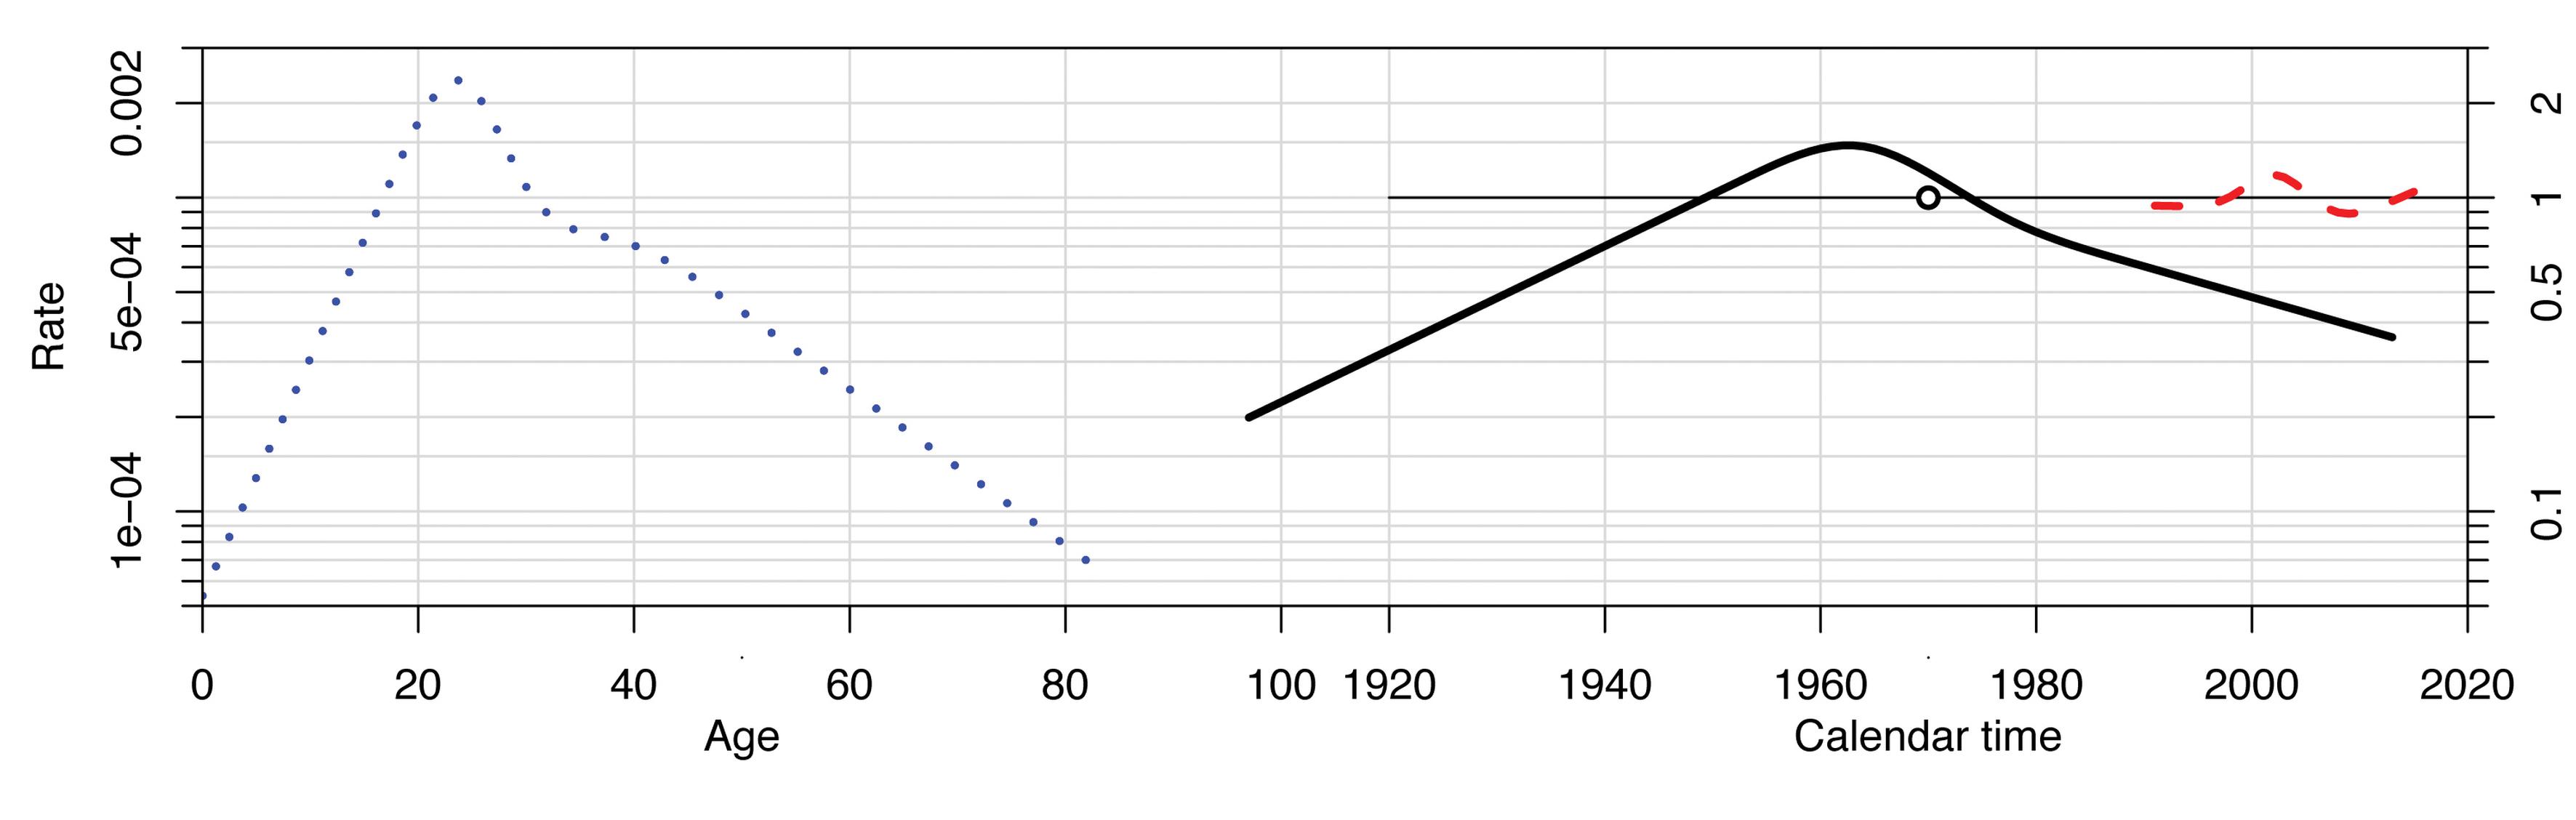
Statistical approaches enable us to interpret the same data through fitting an age-period-cohort model. This method assesses the rate of male motorcycle accidents broken down by each factor: the age of the individual, the time-period and the birth year (the cohort). For more information on how this model is applied, see Carstensen et al, 2017.
Breaking down the data in this way gives us more information. What is immediately apparent is the age-related effect (blue dotted line). It is clear from this graph that there is a higher level of injury rate in young people, from late teens to early 20s, across all cohorts. This heightened accident rate in the young is well-known to insurers (and to any young person getting insurance for the first time). The first conclusion to draw is that population by age (or historic birth rates) will be an important factor in predicting future accident rates.
What is novel about this approach is that the cohort effects (black line) can also be clearly seen. In the early 2000s, road safety professionals were anecdotally talking about 'born again bikers', due to a high injury count being observed among 40-something riders. This analysis suggests that the 1960s cohort (the ‘Easy Rider’ generation) exhibited a higher accident rate than previous or subsequent cohorts and that this cohort (which started riding before Compulsory Basic Training licence restrictions where introduced) carried a higher injury risk with them as they aged. The dotted red line pulls out the year-on-year variability observed in the data.
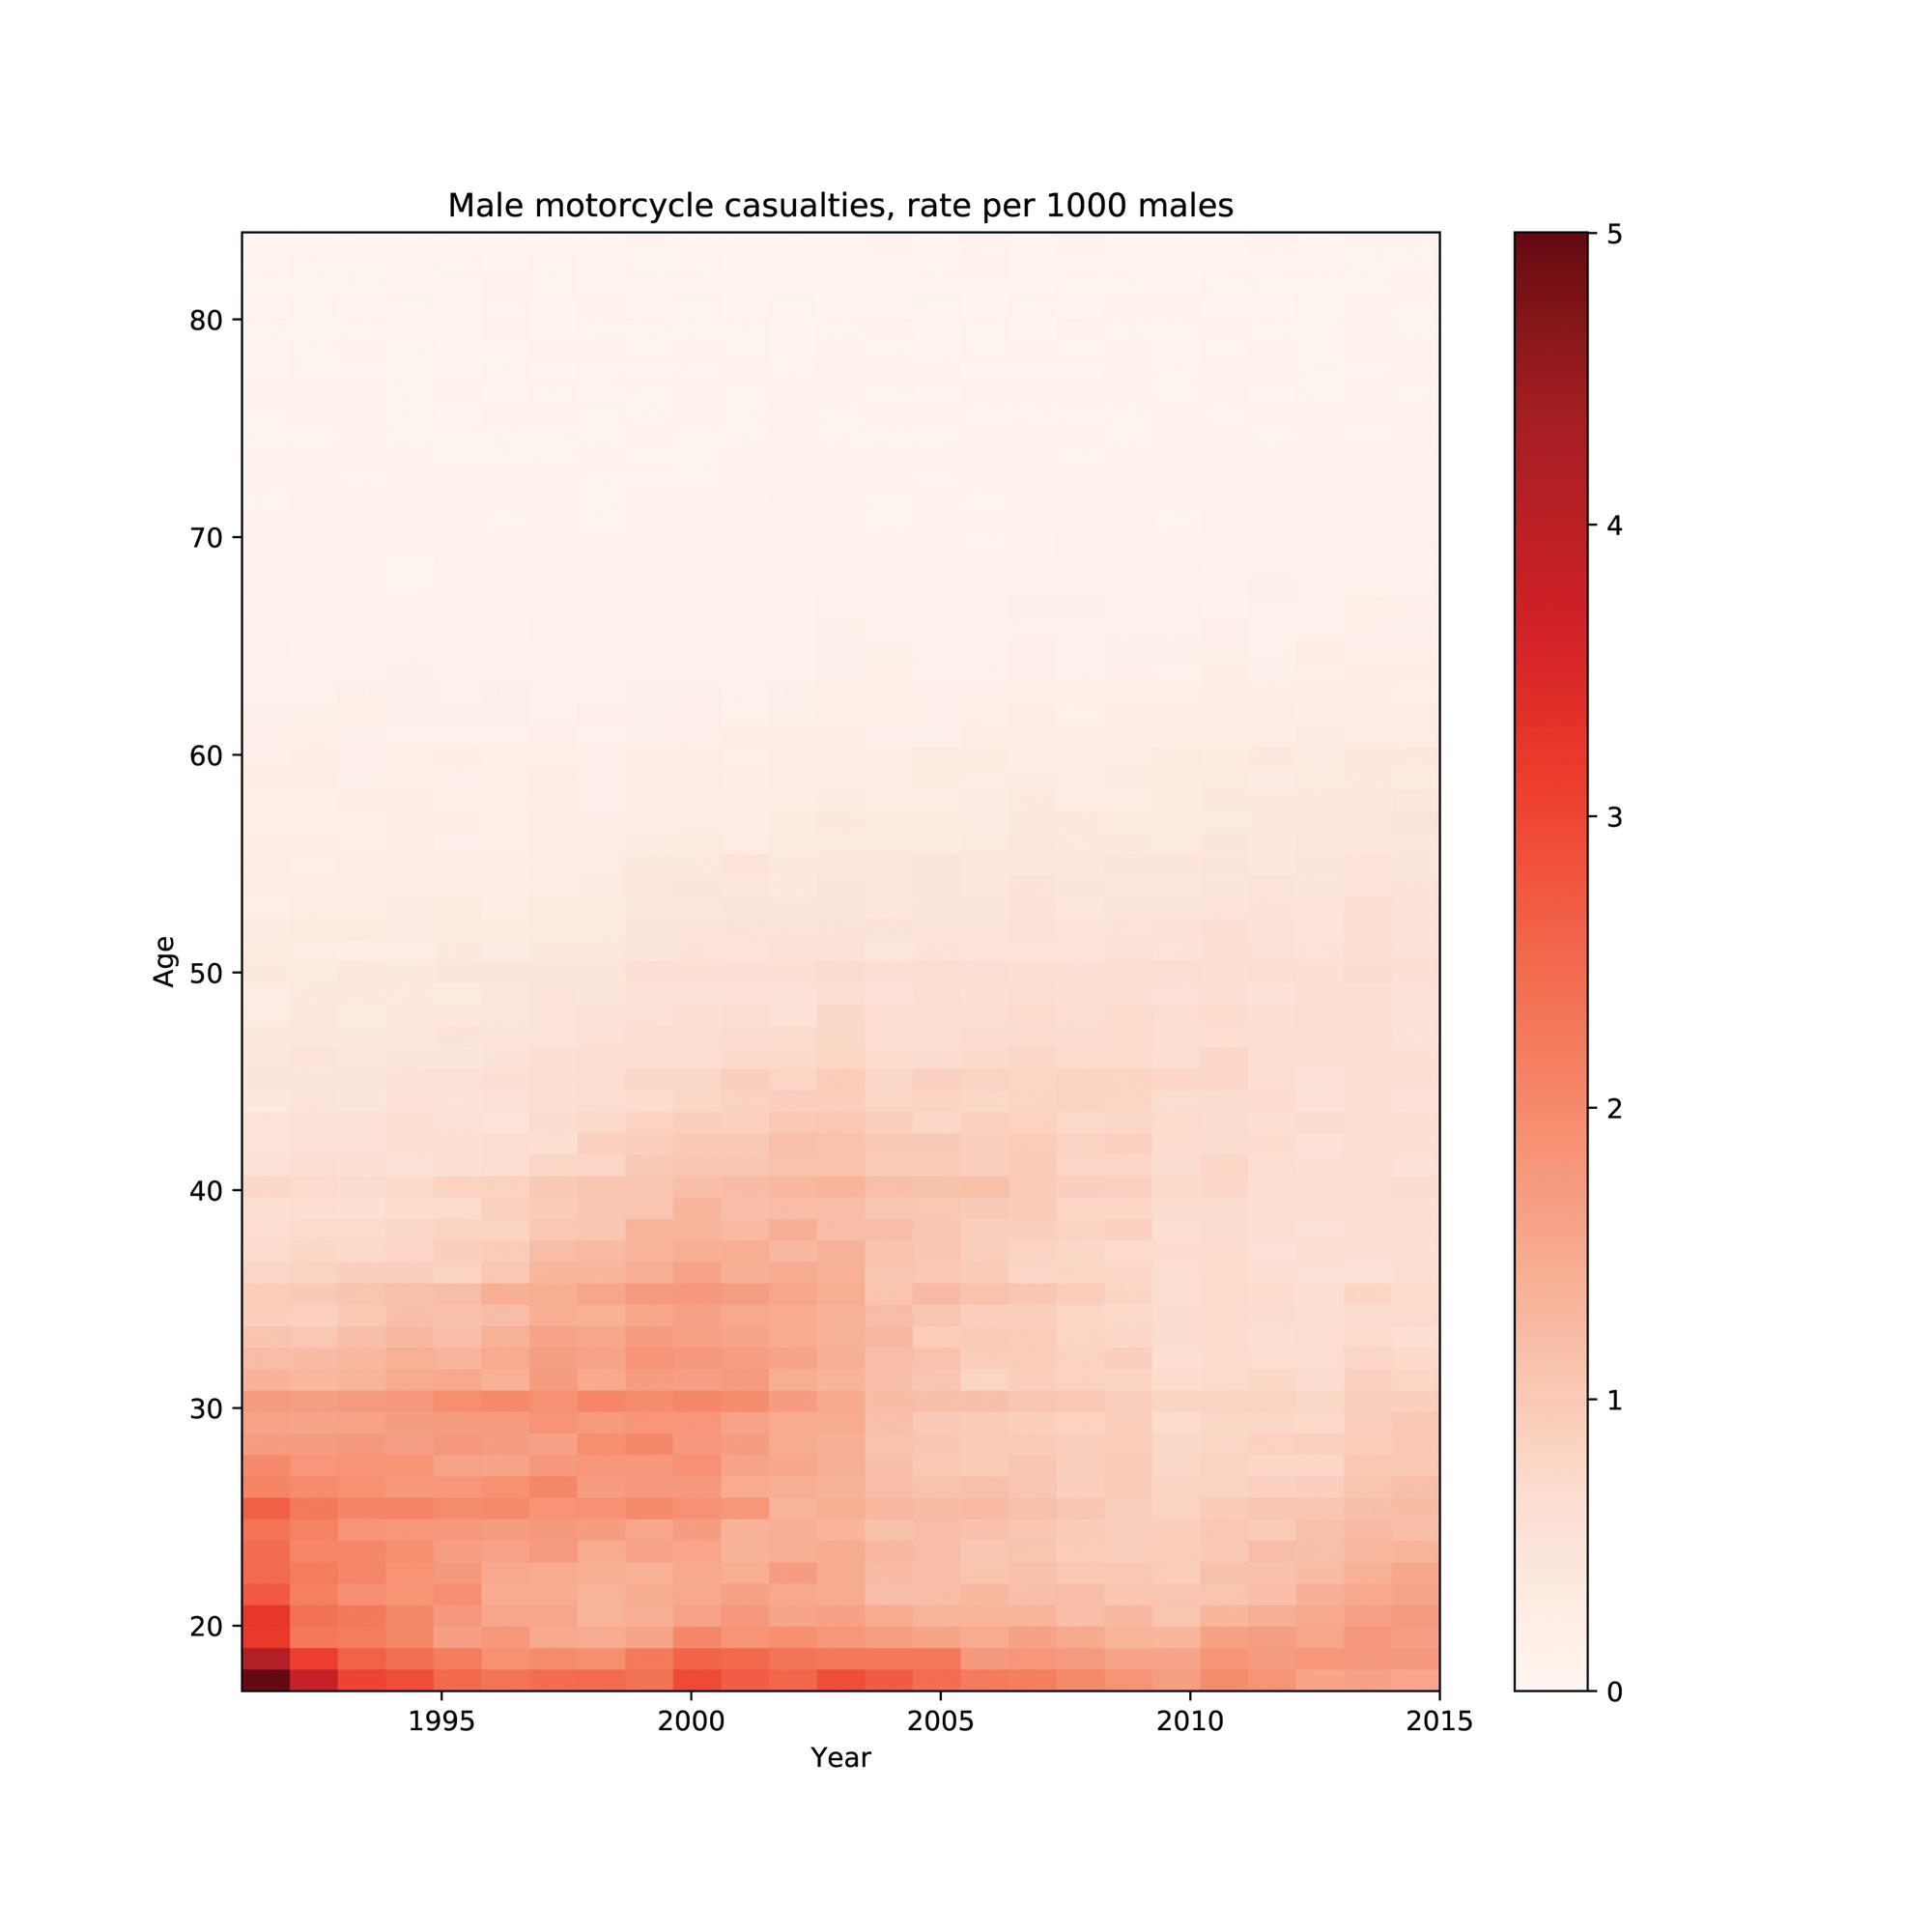
While the modelling approach gives some richer insights, it also has its flaws. In its attempt to smooth data over time, this approach may miss early indications of new cohort effects emerging. To explore this idea, we present the same data plotted in a slightly different way. This view (figure 3 below) is known as a Lexis diagram. It shows a heatmap for motorcycle injury rates in Great Britain per 1000 males, where from left to right we plot the year of the reported injury, and from bottom to top we plot the age of the casualty.
Here we can clearly see a darker band of red along the horizontal-axis which represents the known higher injury rate among those in their late teens and early 20s. We can also see the cohort effect picked up by the model above. Take a close look at young riders (those aged 16-30) in 1991 and follow the darker red pattern diagonally upward and to the right. In 1991 there was a particularly high rate of injury reported among these young riders and we can clearly see that this cohort continues to experience a higher injury rate as they age.
The key feature of this plot that isn’t pulled out in the modelling approach can be spotted in the bottom right region. Here we can see that injury rates in 2015 among the 20-30 age group is higher than it was in the 2005-2010 timeframe, and that a diagonal pattern appears to be emerging. Could this be a cohort displaying early signs of a more persistent trend? This cohort doesn’t appear in the modelling approach above because there are not enough years of observations to catch it. The model is data-hungry and needs a lot of backward-looking data, while the human response is to at least flag the risk that a new cohort effect is being established. A straw poll around our office was quick to point out that a cohort that grew up playing Grand Theft Auto and watching The Fast and the Furious might not be that dissimilar from the Easy Rider generation. This then leads to many further questions, for example – to what extent is this recent change statistically significant? What would it mean for future accident rates if this cohort effect was persistent and what is the most appropriate response by policy makers, given both the risk and uncertainty?
While modelling for reasons of interpretation may well be challenging, age-period-cohort models have been very widely used when forecasting disease burden into the future. The same techniques can be used in transportation – for example developing age-period-cohort models to forecast the likely burden of motorcycle injury in the medium-term future, taking into account the age-related injury risk profile as well as year and cohort-related effects. Those models can give greater or lesser weight to newly emerging trends to test the likelihood and impact of different interpretations.
At City Science, we believe that the importance of cohort effects should be obvious in the context of transport planning. In technology terms alone, Millennials have experienced worldwide events in real time, in ways very different from their parents. Using about three connected devices every day and making over half of their purchases online, Millennials and Centennials are driving the ‘shared-economy’ and changing the way we interact with the transport system in ways we are only beginning to appreciate fully.
But we also believe we can go further – not just passively observing cohort effects, but actively building them into our strategic plans for the future. Transport interventions that work on a carefully selected cohort may show modest impact immediately. However, with interventions designed to deliver, monitor and manage a cohort effect, the potential impact is much greater as both the original cohort ages and subsequent cohorts respond to the new way of functioning. Walking and cycling are prime areas where specific cohort interventions today, combined with appropriate infrastructure, offer the opportunity to make long-lasting impacts on congestion, air quality, health and the vibrancy of our cities.
Paul Hewson is Senior Data Scientist at City Science
TransportXtra is part of Landor LINKS
![]()
© 2026 TransportXtra | Landor LINKS Ltd | All Rights Reserved
Subscriptions, Magazines & Online Access Enquires
[Frequently Asked Questions]
Email: subs.ltt@landor.co.uk | Tel: +44 (0) 20 7091 7959
Shop & Accounts Enquires
Email: accounts@landor.co.uk | Tel: +44 (0) 20 7091 7855
Advertising Sales & Recruitment Enquires
Email: daniel@landor.co.uk | Tel: +44 (0) 20 7091 7861
Events & Conference Enquires
Email: conferences@landor.co.uk | Tel: +44 (0) 20 7091 7865
Press Releases & Editorial Enquires
Email: info@transportxtra.com | Tel: +44 (0) 20 7091 7875
Privacy Policy | Terms and Conditions | Advertise
Web design london by Brainiac Media 2020