
Streetlytics allows users to make well-informed decisions by providing direct access to detailed, ready-to-use insights on a particular population, its activity, and movements across all modes of travel from the current day into the future. As traffic analysts, we need to know the reasons why travel is happening, as well as key facts about the trips and flows on our streets and transport services. The questions asked in traffic operations and in modelling are who, when, where, why and how.
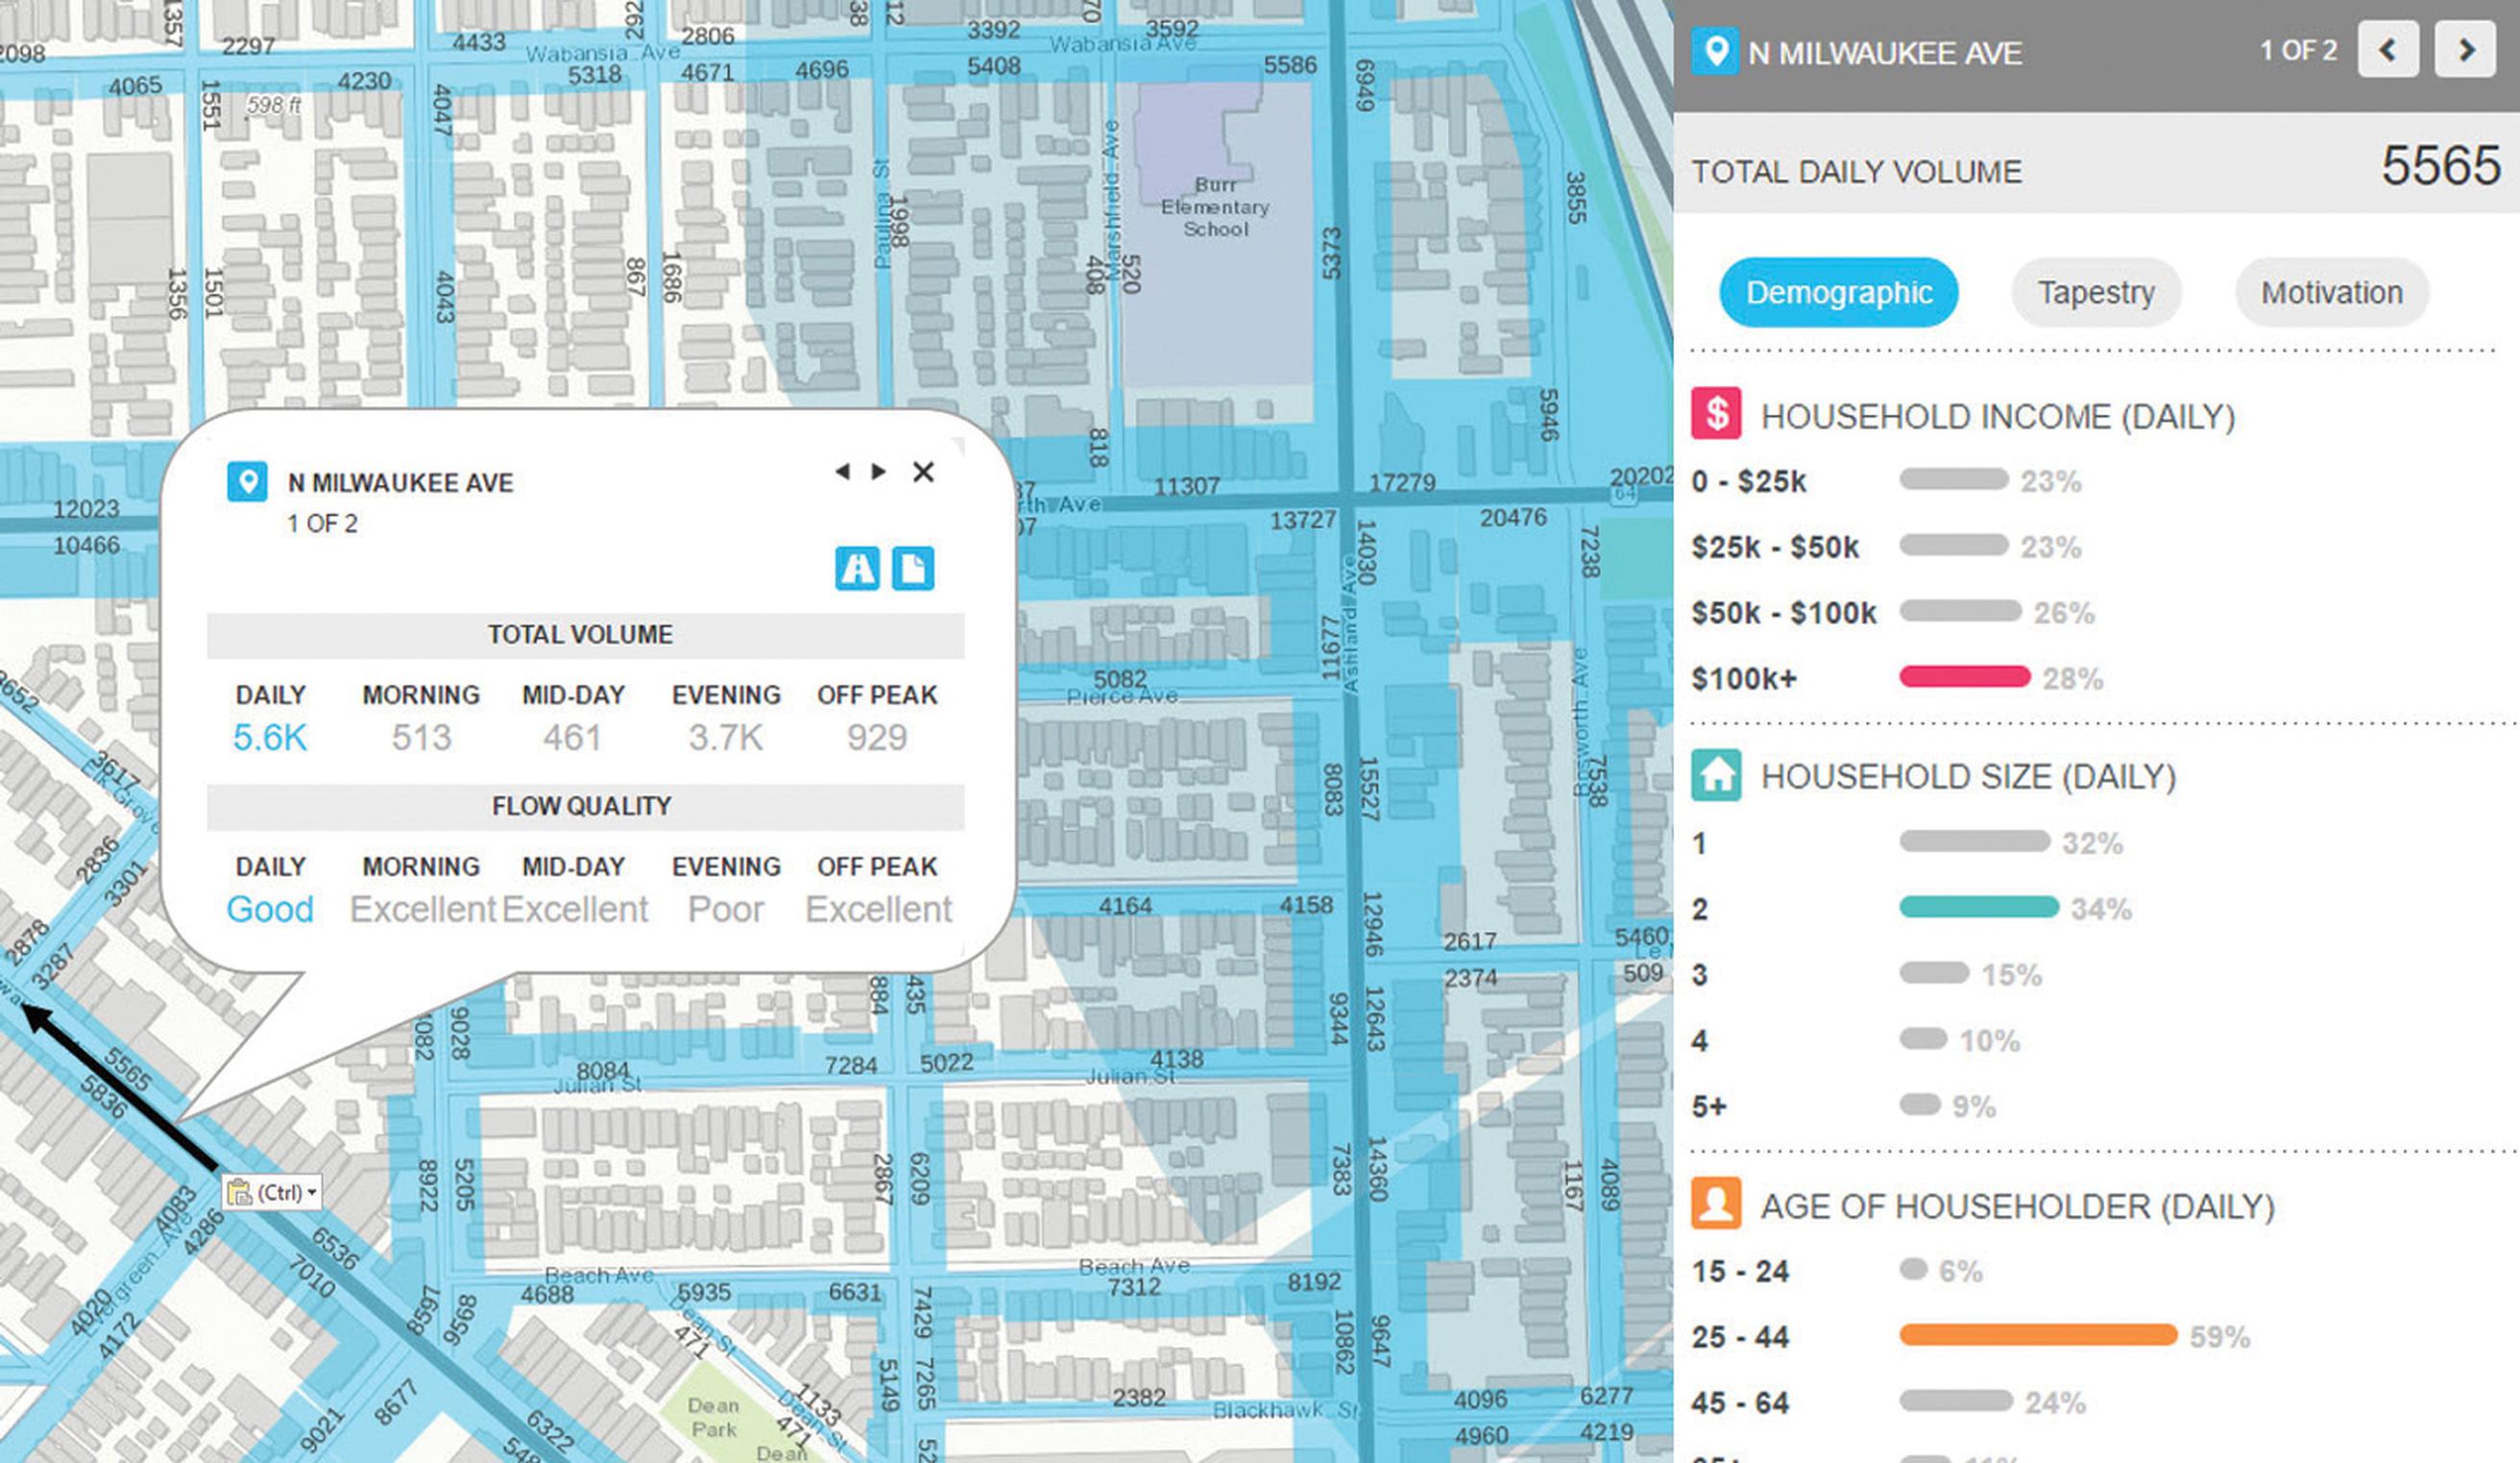
WHO: Understand the population present in an area by the time of day and the day of week. Know who is travelling down a specific roadway or using a specific public transport line. Who will be impacted by any forthcoming project or maintenance works?
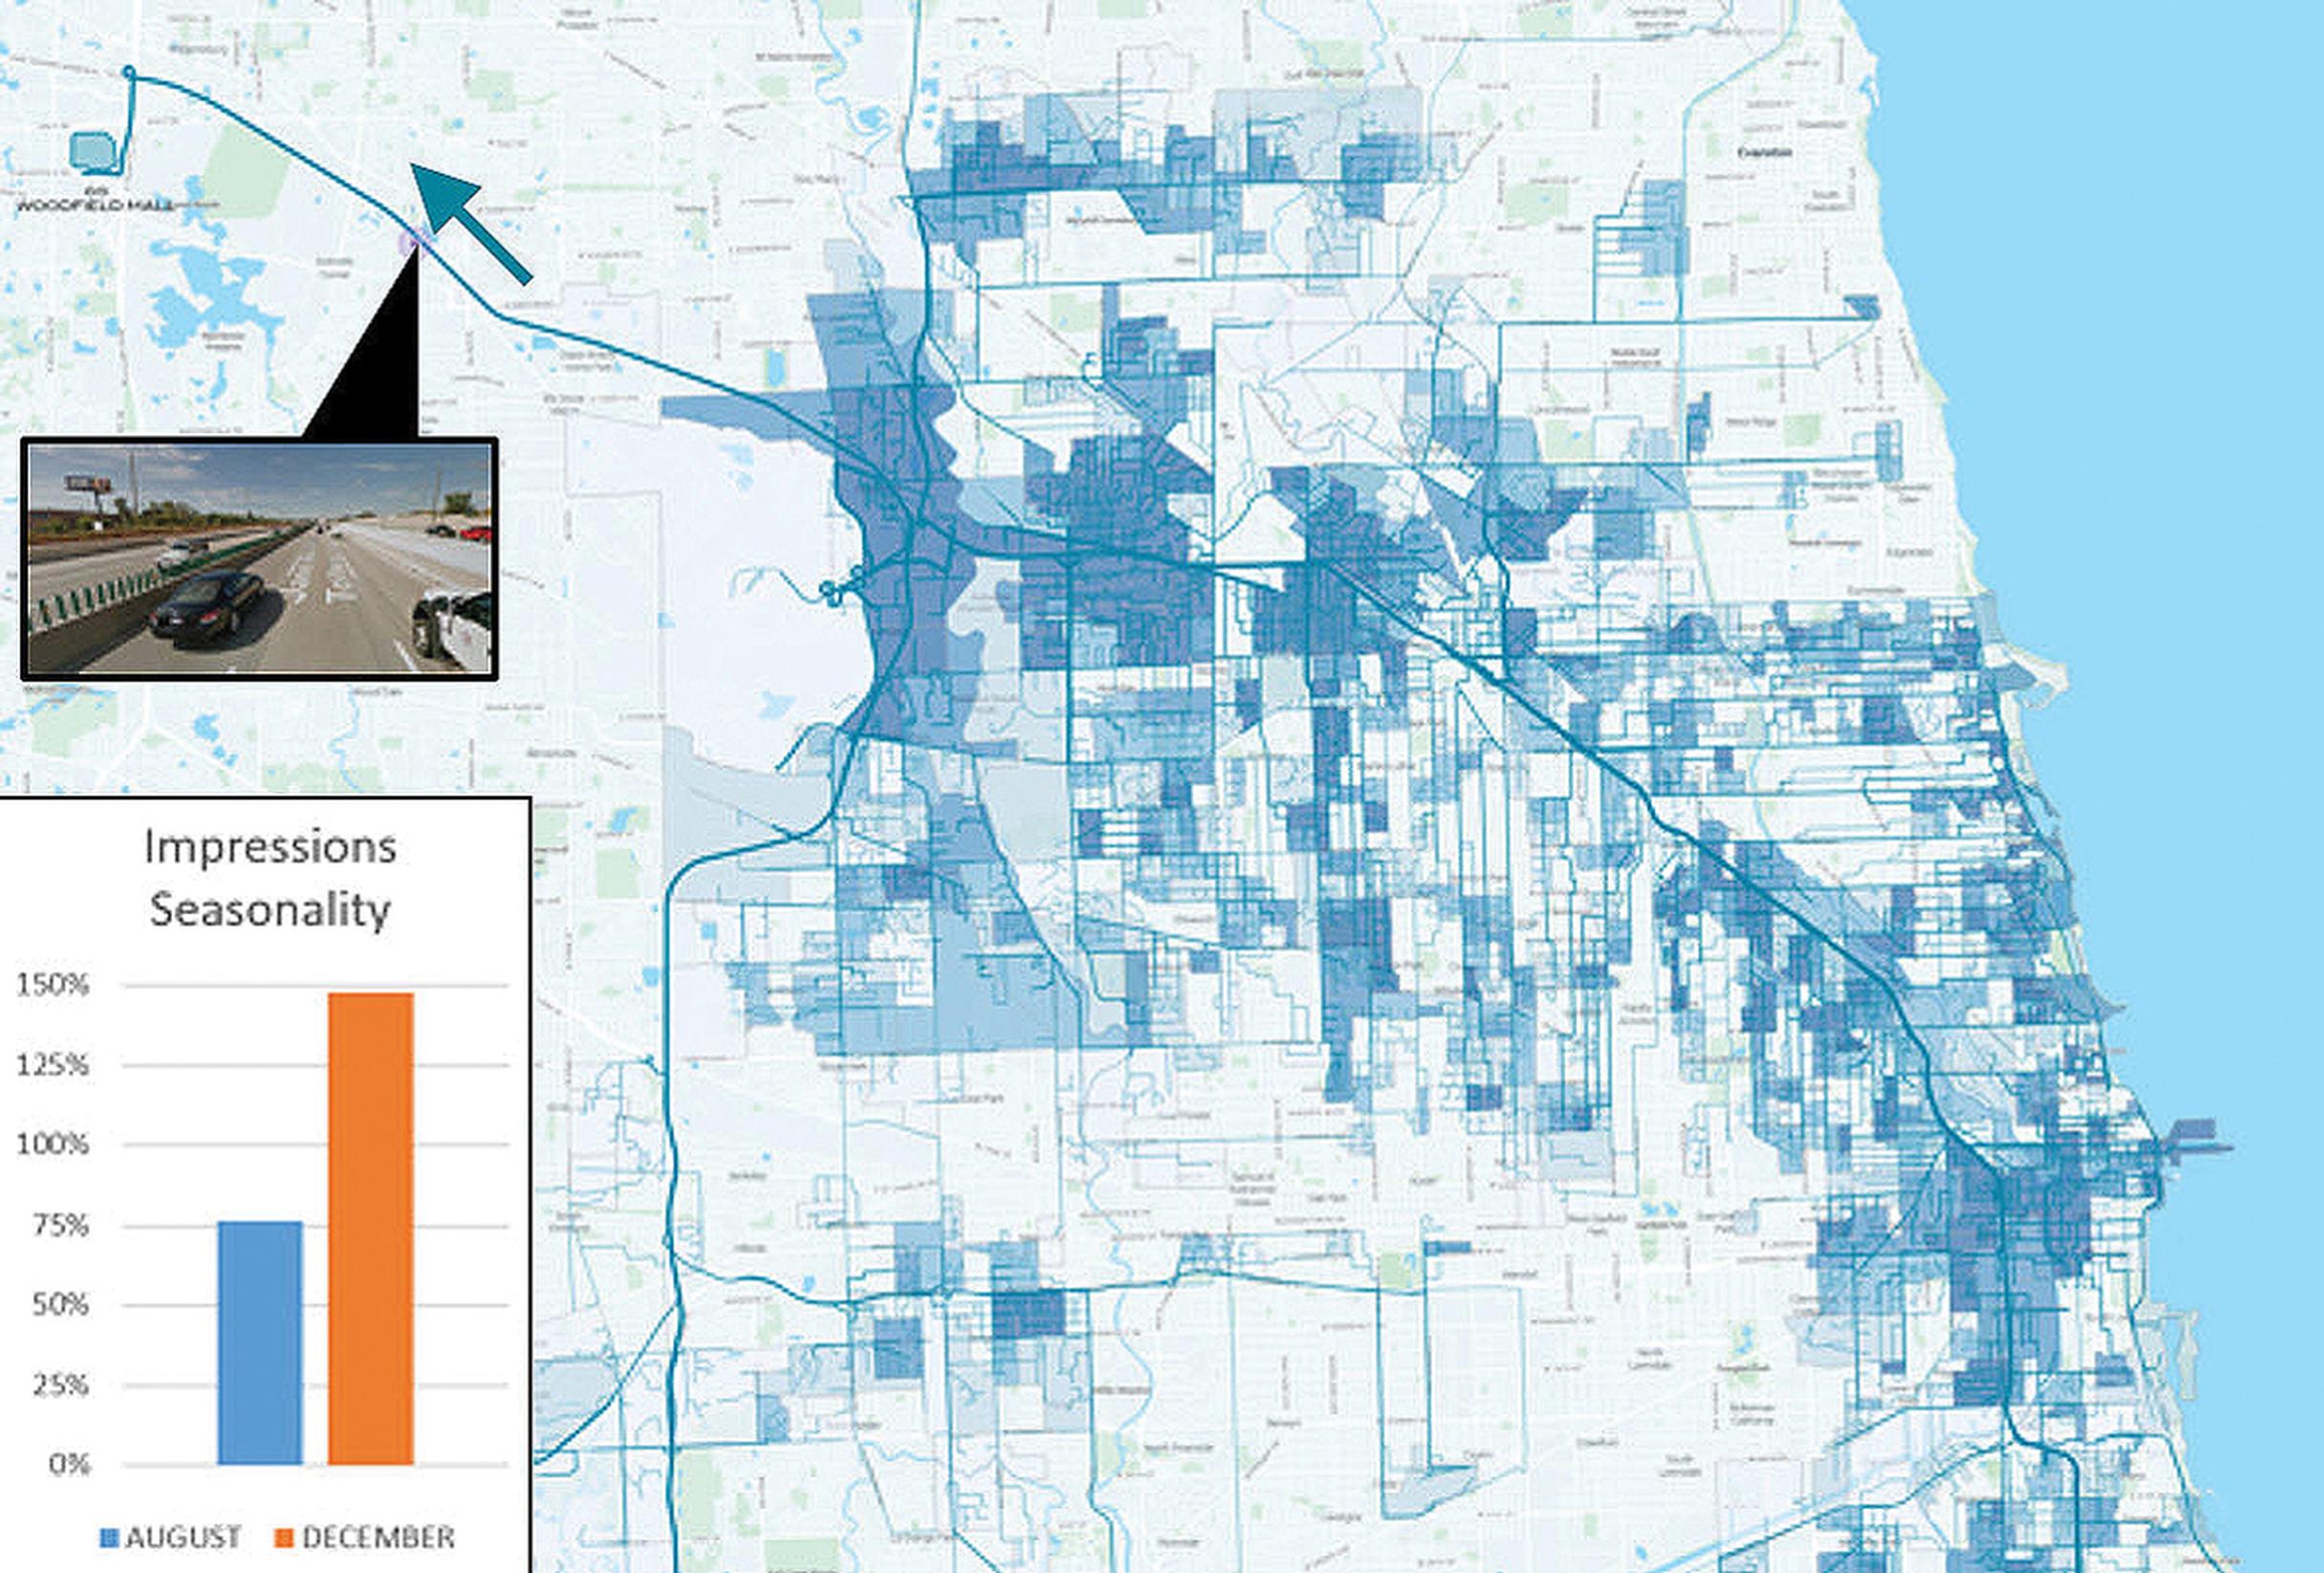
WHEN: Understand how traffic levels differ by time of day, day of the week, month of the year and the activity patterns of a target population. When are the best times to schedule maintenance works for minimal impacts?
WHERE: Understand the trips being made down a specific roadway. Where did they start? Where they are going? Understand where your target population lives, works, and shops and, its movement patterns. Where can I locate services convenient to an under-served population?
WHY: Understand why a population is in a certain area, and what factors impact why people drove to an area versus taking public transport. For the population in any given area, how many are there for work, for shopping, for leisure?
HOW: Understand how a target population travels, and what factors impact on mode choice? How many commuters in the city centre drove to their destination today?
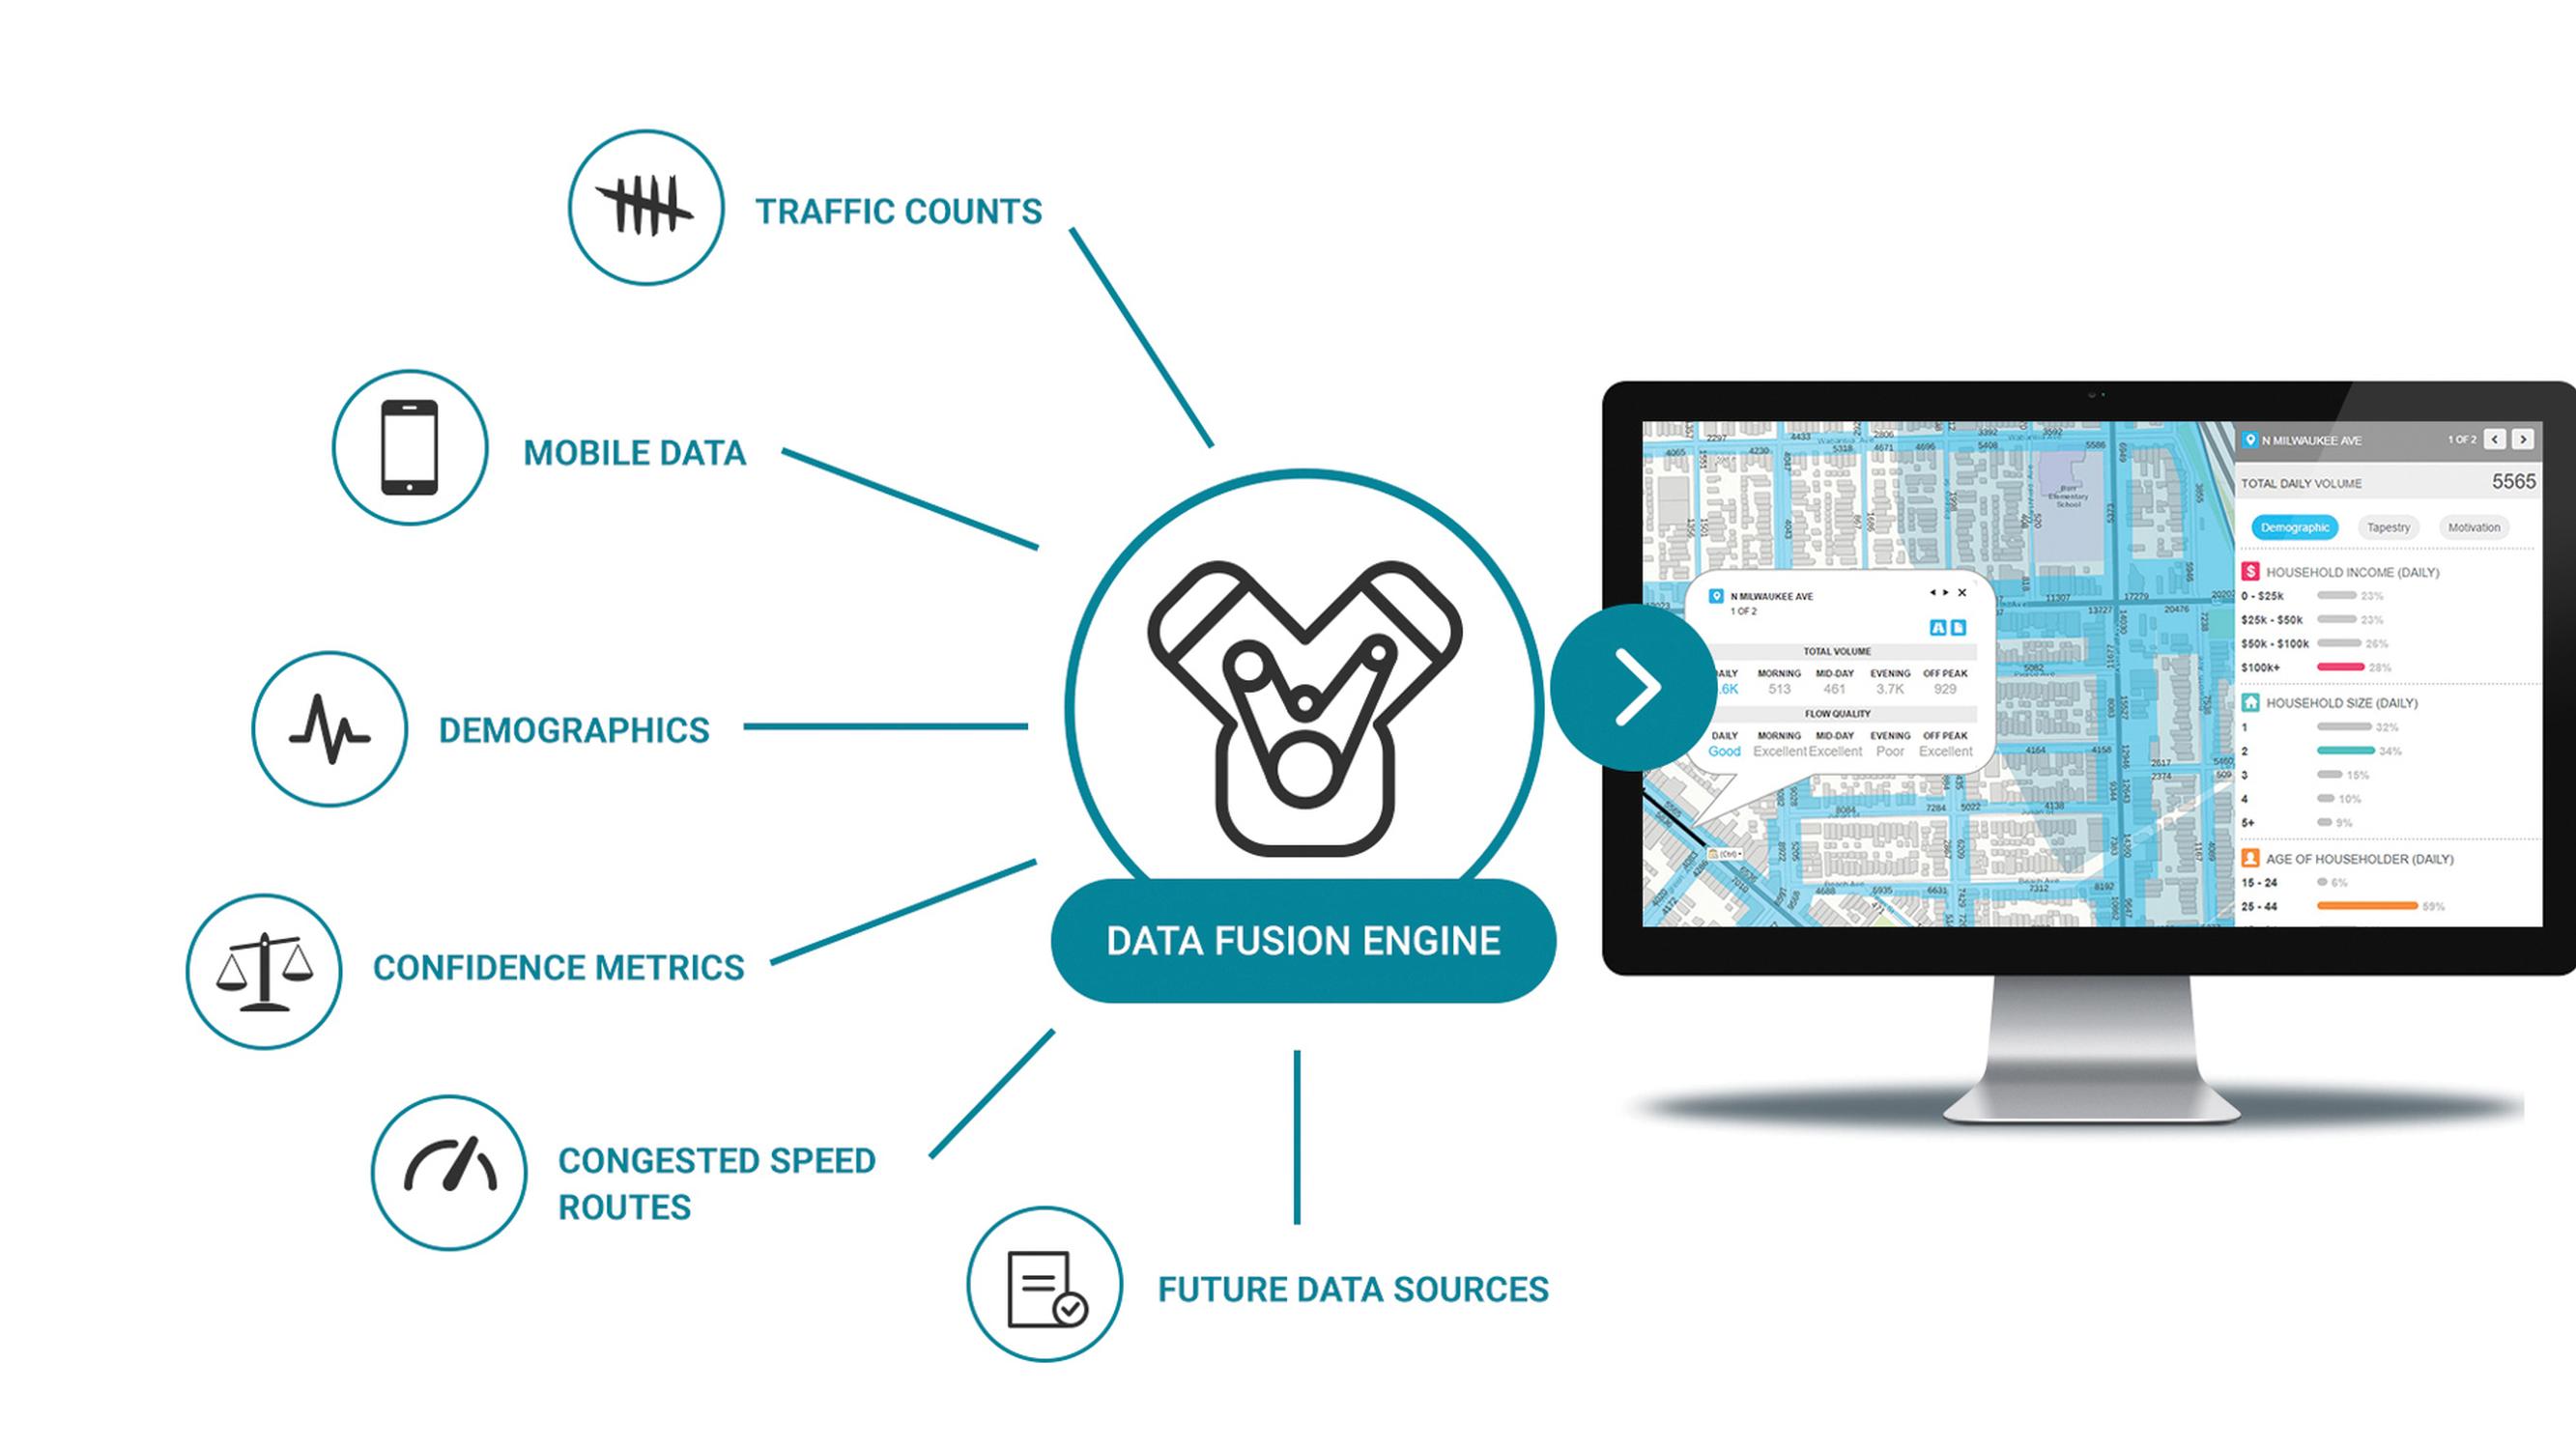
The step-by-step Streetlytics Data Fusion Engine process:
1. Data is collected from wireless signalling data providers
2. Device locations are processed
3. Activity patterns are analysed and activity points are generated
4. Trips are analysed
5. The data is aggregated and packaged
6. The full population is synthesised
7. Travel mode choices are assigned
8. Travel routing possibilities are simulated and assigned
9. A final data set is assimilated for publication
Each of these observations and estimations are given a specific confidence level. For example, a traffic count from last year would have a much lower confidence than one that continuously streams count data in real-time.
Then, utilising its extensive expertise in traffic analytics, Citilabs has developed a proprietary process that incorporates the qualities of each type of observed data to produce a single view of all travel. This minimises the deviation from any one perspective of travel, while taking into account the expected reliability of each observation.
Streetlytics provides Origin-Destination matrices for the current year by:
This data is kept up to date on a regular basis (weeks and months rather than years) and this opens up interesting opportunities for modelling.
The obvious application for longer-term, strategic travel demand forecasting will be to use these data sets for model estimation and calibration purposes. There’s no need for traditional time- and cost- consuming surveys, and the added possibility of keeping model data and parameters up to date at all times. The data will automatically absorb new trends, including those that can be expected as disruptive technologies starts to affect our lives and behaviour.
There are ongoing discussions about the value of our traditional models and their assumptions and methods. Some are saying that big data is the answer. Citilabs will not agree with this view, as long-term models cannot entirely be based on current travel behaviours. But there is certainly potential for incremental models based on present day traffic analytics such as provided in Streetlytics.
There are three basic approaches to forecasting:
The traffic analytics platform provides an independent and rigorous absolute model for the current year and a ‘perfect’ base for the incremental model.
The independent base situation is provided by Streetlytics OD patterns. The forecasting model is applied for the base year and for the future year. The difference is applied directly to the base situation. There are some clear advantages:
There might be some disadvantages caused by OD relations with no trips, less trips in the future (can lead to negative trips). The modeler must carefully examine these effects and also potential issues related to factoring versus addition of trip change.
One acknowledged methodology for absolute models applied incrementally is Rand Europe’s 8-case method (Daly et. Al 2005). Using Streetlytics OD as a base observed matrix and then applying the predicted change in demand using the 8-ccase approach offers an excellent new methodology for forecasting demand.
Tor Vorraa is Regional Director at Citilabs
TransportXtra is part of Landor LINKS
![]()
© 2026 TransportXtra | Landor LINKS Ltd | All Rights Reserved
Subscriptions, Magazines & Online Access Enquires
[Frequently Asked Questions]
Email: subs.ltt@landor.co.uk | Tel: +44 (0) 20 7091 7959
Shop & Accounts Enquires
Email: accounts@landor.co.uk | Tel: +44 (0) 20 7091 7855
Advertising Sales & Recruitment Enquires
Email: daniel@landor.co.uk | Tel: +44 (0) 20 7091 7861
Events & Conference Enquires
Email: conferences@landor.co.uk | Tel: +44 (0) 20 7091 7865
Press Releases & Editorial Enquires
Email: info@transportxtra.com | Tel: +44 (0) 20 7091 7875
Privacy Policy | Terms and Conditions | Advertise
Web design london by Brainiac Media 2020