
London's Urban fabric is constantly changing, whether it be new shopping centres, housing developments, hotels and office blocks, or new transport infrastructure and traffic management schemes.
But what impacts will such developments have on travel patterns, and how will they affect levels of congestion on the highway and public transport networks? Transport models can provide insights to these questions and, in doing so, inform decisions about whether developments should go ahead and what mitigating measures may be needed to tackle unwanted side effects.
In London, whenever a major new scheme is developed, the tendency has been to build a new model. But Transport for London has now taken delivery of a set of sub-regional models that will provide greater transparency and consistency for decision-making.
The multi-million pound project has taken just over two years to complete and engaged some of the best modelling minds in the country. Overseeing the exercise has been Nigel Campbell, TfL’s director of policy analysis. Campbell, an economist for most of his career, joined TfL in 2008 from the DfT where he’d latterly had policy responsibilities including cycling, ‘sustainable travel’ and Greater Manchester’s abortive Transport Innovation Fund congestion charging and public transport investment bid. He now manages a team of about 40 staff, which is part of TfL’s planning group led by Michèle Dix.
Campbell’s team undertakes a wide-ranging set of activities. It was heavily involved in the preparation of the Mayor’s transport strategy published last May, as well as the sub-regional transport plans for North, East, South, West and Central London released last autumn. It also provided advice on the transport implications of different spatial development policies that has fed into the London Plan, which is due to be published in final form later this year. And it produces the Travel in London reports and provides analysis to help identify how the Mayor’s goals such as boosting cycling levels, cutting carbon dioxide emissions and improving the capital’s air quality can be achieved.
Inevitably, the team’s work involves a lot of number-crunching and computer models are an important part of the toolkit. Campbell and his team aim to keep abreast of developments in modelling and consequently use a number of models, ranging from air quality, Land Use-Transport Interaction (LUTI) and tour-based behavioural models to the traditional, classic four-stage models (trip generation, trip distribution, mode choice and route assignment).
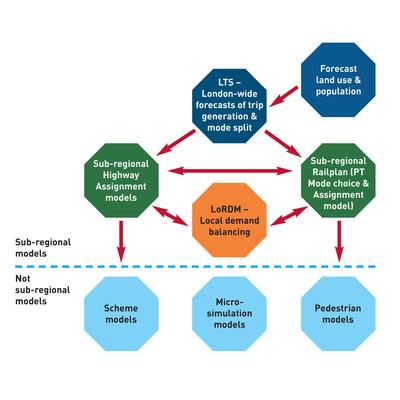
To simplify the picture of how they fit together, at the top of TfL’s modelling tree sits the LTS (London Transportation Studies) multi-modal model, developed over time mainly by MVA Consultancy. LTS produces forecasts of total trips and mode split using input data about population, employment, land-use and economic growth and data about the capital’s transport networks.
TfL also has a London-wide public transport model – Railplan – that, despite its name, covers Underground, Overground, National Rail, Docklands Light Railway, tram and London bus services.
Open a copy of one of TfL’s planning documents and if you see a map of London showing predictions of future highway congestion by zones it’ll be based on LTS. And if you see a map showing predicted overcrowding on the Tube network then that will have been prepared using Railplan.
“LTS is fine for having an overall stab at getting from population and employment to total travel and mode shares and broad estimates of changes to crowding and congestion,” says Campbell. “But for assigning traffic to the highway network for a specific scheme or development it is nothing like detailed enough.” (Similarly, Railplan’s analysis has also historically been weaker outside Central London).
The tendency has therefore been to build one-off models to assess the implications of new land-use developments or new transport schemes on the transport network. But Campbell says this has a number of downsides.
“Firstly, you end up building a new model every time you’ve got a new scheme. Secondly, if you want to compare two things – is this scheme better than that scheme? – the answer is often ‘don’t know, they’ve been assessed using different models’.
“Likewise, if we’re going to have more development at two places – say White City and Earls Court – and want to know the combined effect, you can’t establish the cumulative impact properly if they’ve been assessed using different models.”
He says a further drawback of having models built for specific projects is that scheme promoters and opponents can spend a lot of time debating the finer points of the modelling. “Public inquiries can spend quite a lot of time arguing over this feature or that feature of the model. It’s a proxy for debating the substance – people who were against, let’s say, Heathrow Terminal 5 and people who were in favour argue over the detail of the model, rather than actually what the consequences [of building the terminal] will be. And all the time they’re arguing about the model’s detail, rather than concentrating on the substance, the costs of the inquiry go up.”
All of this helps explain why TfL decided to commission a set of sub-regional models. In all, five highway assignment models (HAMs) have been built and Railplan has been given an enhanced sub-regional capability.
The HAMs cover North, East, South, West and Central London and have catchy acronyms: NoLHAM, ELHAM, SoLHAM, WeLHAM and CLoHAM. “For Central London there were highway models there before, but we’ve effectively started from scratch – as required by DfT’s WebTAG guidance – and improved on them. The other four didn’t really exist before,” says Campbell.
The models use the SATURN (Simulation and Assignment of Traffic to Urban Road Networks) software package developed by the Institute for Transport Studies at the University of Leeds and distributed by consultant Atkins.
Each HAM contains a representation of the whole of the UK, with increasing detail in the simulation area. Within the relevant London sub-region all the A and B roads and parts of the C road network are modelled.
Campbell explains that two of the models have just over 1,000 zones in the simulation area, and in one (South London) the number exceeds 2,000. The other two – Central and North London – have 500 and 800 zones in the simulation area respectively. “One of our considerations when we thought LTS needed supplementing was should we have a London-wide more detailed model?” Campbell recalls. “But you can’t have 6,000 zones in SATURN and get a model run time that is acceptable. The excellent PRISM model of the West Midlands has nearly 1,000 zones, and so we felt confident that this size of model could work.”
Different consultants developed each model, and in each case one firm was appointed to build the road network and another to build the matrices (see table).
Instead of commissioning the models all at once, TfL used a phased process so that lessons could be learned along the way. After the North and Central models had been developed, a peer review was commissioned from some of country’s top modelling experts – Mick Roberts of MVA, Paul Hanson of Aecom, Ian Williams of WSP, Andy Southern of Atkins, Denvil Coombe and Luis Willumsen – which helped inform how the next three were developed.
Campbell says an innovative approach was taken to developing the models. “If you want an outrageous analogy, how models are normally put together is a bit like building an aircraft and then seeing if it flies,” he explains. “You do the network, the matrix – the matrix synthesis and the matrix estimation – and then you see if it works. Then you improve the validation performance. Sometimes in the latter stages that includes correcting errors in earlier activities such as the network. Aircraft manufacturers do serious tests of each component as they go along.”
TfL therefore worked with consultants to develop tests of the network, matrix synthesis and matrix estimation that were applied once each work stage was complete. “We sat down with the experts in network coding and devised a series of tests to prove the coded network independently from the rest of the model. Similarly, with the matrix, a series of tests were developed that proved the matrix as it was built up.”
He gives a flavour of the type of problem that the network test can uncover. “Is the number of vehicles you can expect to get through a junction plausible? Sometimes you can pick up gross errors – for example, if people have transposed the coding of two roads so that the major road seems to have less flow than the minor road.
“It may sound trivial, and certainly most experienced modellers would not make such mistakes. However, the large size of the models and vast number of junctions to be coded – over 3,000 junctions and over 10,000 links in the simulation areas of each model – mean that errors can creep in.”
To complement the HAMs, Railplan’s sub-regional modelling capability has been transformed. “What we’ve done is enhanced and improved it, doubled the number of zones, improved massively the walk links, improved how it’s validated, especially outside central London,” says Campbell. There’s also now a much better representation of bus flows, particularly in outer London.
“The sub-regional Railplan model is in fact one model rather than five but it can work with each of the five highway models,” he explains.
The Railplan work was led by in-house staff at TfL, with support from Steer Davies Gleave and URS and other consultancies in TfL’s Railplan forum. Campbell says this way of working, with TfL taking increasing technical ownership of how the models are designed and developed, but always working in close collaboration with external experts, has been a theme of how the models were developed. “We feel it is important to establish a community of transport modellers in London, with TfL taking an active technical role to lead model innovation and development to ensure that it is focused to allow us to meet the Mayor’s objectives,” he says. “This really has been a team effort, involving both in-house TfL staff and consultants.
“We could have stopped there,” says Campbell, but he explains that TfL has also commissioned a ‘local demand balancing’ model to complement the HAMs and Railplan. The London Regional Demand Model (LoRDM) – whose different elements have been developed by MVA, URS, Atkins, WSP and Halcrow – takes changes in the generalised costs (time and money) of travel produced by the HAMs and Railplan, and calculates how many people will change their mode of travel and where they live and work, continuing to iterate between roads and public transport until an equilibrium is reached.
The models were completed last year and Campbell appears pleased with their performance. “CLoHAM provides a good example of the level of performance that can be achieved. The individual link validation in the am peak shows 85% of links match to the observed flows within the tolerances specified in the Design Manual for Roads and Bridges and 68% of journey times are within 15% of the observed journey times.”
They have already been used for a number of projects. Two of the first uses were for the White City Opportunity Area Planning Framework and to assess ways of mitigating the disruption caused by junction improvement work to the A406 North Circular Road at Henlys Corner. “They’re exactly the sort of techie things that we would normally have had to build a model for,” says Campbell.
Other applications have included a bus priority scheme in North London, the two-way operation of Piccadilly in central London and the impacts and potential mitigation measures required for developments in the Upper Lea Valley opportunity areas.
Campbell is keen for the sub-regional models to be used as much as possible, whenever it is technically appropriate to do so. TfL will be a major user of them but so too will be boroughs, developers and “anyone else who wants them”. Boroughs can use the models free of charge but developers and others will be charged a licence fee per model component that will go towards the upkeep of the models (£10k per HAM, £10k for Railplan, £5k for LoRDM, £15k for LTS. So a bigger study could have to pay up to £25k-40k, a smaller study £10k).
He illustrates how the models will be used in practice. “We will give the study sponsor the model and what we call the ‘reference case’, which is the prediction for the future year. We start with LTS and then run it through the highway assignment model so you get more detail about Central or West London or wherever.
“So we give them that and that’s the base from which the user then says, ‘Ah, but I’m going to develop more in Earls Court or less here, or have these transport schemes’.”
TfL has drawn up a list of accredited consultants who are authorised to use the models. “We’d expect developers and boroughs to typically contract the work out – I’m sure the developers will,” says Campbell. He says TfL plans to do more in-house modelling for schemes. “We’re increasing our in-house capability, partly to save money and partly because we think it’s a better way to do it. But we’ll still contract some work out.”
Study sponsors will have to prepare a short report for TfL after they finish using the models. “What we’re saying is we’ll make the model available to you but one of the conditions is that at the end of the process, we want you to give it back with an assessment telling us what changes you’ve made, what data you’ve collected, and a small report from the consultant saying which of those they would think it would be sensible to include in the next iteration and which ones were only really appropriate for that scheme,” says Campbell.
“A typical example is you’d have a proposed development and someone would say ‘I need to make the model a little better in that area – maybe a bit more detail, or maybe get some more data.’
“If it makes the model better there but worse somewhere else, you probably wouldn’t include it, but if you make it better there and no worse elsewhere you probably would.
“When we’ve got three or four of these studies we’d then take all these reports, bring them together and say this is the new version of the highway assignment model.”
Campbell believes the models will reduce the scope for argument at scheme public inquiries. “I can see them leading to a significant diminution in the debate on issues that aren’t central to the proposal under consideration, leaving more time and opportunity to focus on the substance. But they won’t get rid of it entirely,” he says. “If a borough is finding the model useful in pursuing a scheme then if they see the same model in respect of a planning application you can see how that would be less likely to generate debate.
“We’ve seen examples where, if you’ve got a model that is being used by developers, it’s been quite hard to see what they’ve done and the suspicion can be that they’ve tweaked the model in ways that give the results in too favourable a light.
“Now we will be able to say: ‘We’ve all got transparency about what the model is, what’s the set of assumptions that you think are true and we think are true?’ Then you’re at least only having an argument over the range of sensitivity tests.”
| Network | Matrix | |
| North and Central | Mott MacDonald | Halcrow |
| West | Hyder | Aecom |
| East | Arup | MVA |
| South | Atkins | Jacobs |
Note: Technical input and advice across the whole sub-regional model programme was provided by Denvil Coombe, the late Andy Skinner and Tim Cooper of CPC.
TransportXtra is part of Landor LINKS
![]()
© 2026 TransportXtra | Landor LINKS Ltd | All Rights Reserved
Subscriptions, Magazines & Online Access Enquires
[Frequently Asked Questions]
Email: subs.ltt@landor.co.uk | Tel: +44 (0) 20 7091 7959
Shop & Accounts Enquires
Email: accounts@landor.co.uk | Tel: +44 (0) 20 7091 7855
Advertising Sales & Recruitment Enquires
Email: daniel@landor.co.uk | Tel: +44 (0) 20 7091 7861
Events & Conference Enquires
Email: conferences@landor.co.uk | Tel: +44 (0) 20 7091 7865
Press Releases & Editorial Enquires
Email: info@transportxtra.com | Tel: +44 (0) 20 7091 7875
Privacy Policy | Terms and Conditions | Advertise
Web design london by Brainiac Media 2020