Moovit is one of a number of global Mobility as a Service providers. It has around 900 million users worldwide and covers over 3,400 cities. During the Covid-19 pandemic it has been publishing weekly high-level data on the use of its app, with a comparison to usage in a typical week in 2019. We do not know the exact correlation between the number of times people use the app and their propensity to take public transport or total public transport usage. And, as more people use the app, that relationship will change over time, but the data does provide an insight into the interest in using public transport during the pandemic and how that varies between locations.
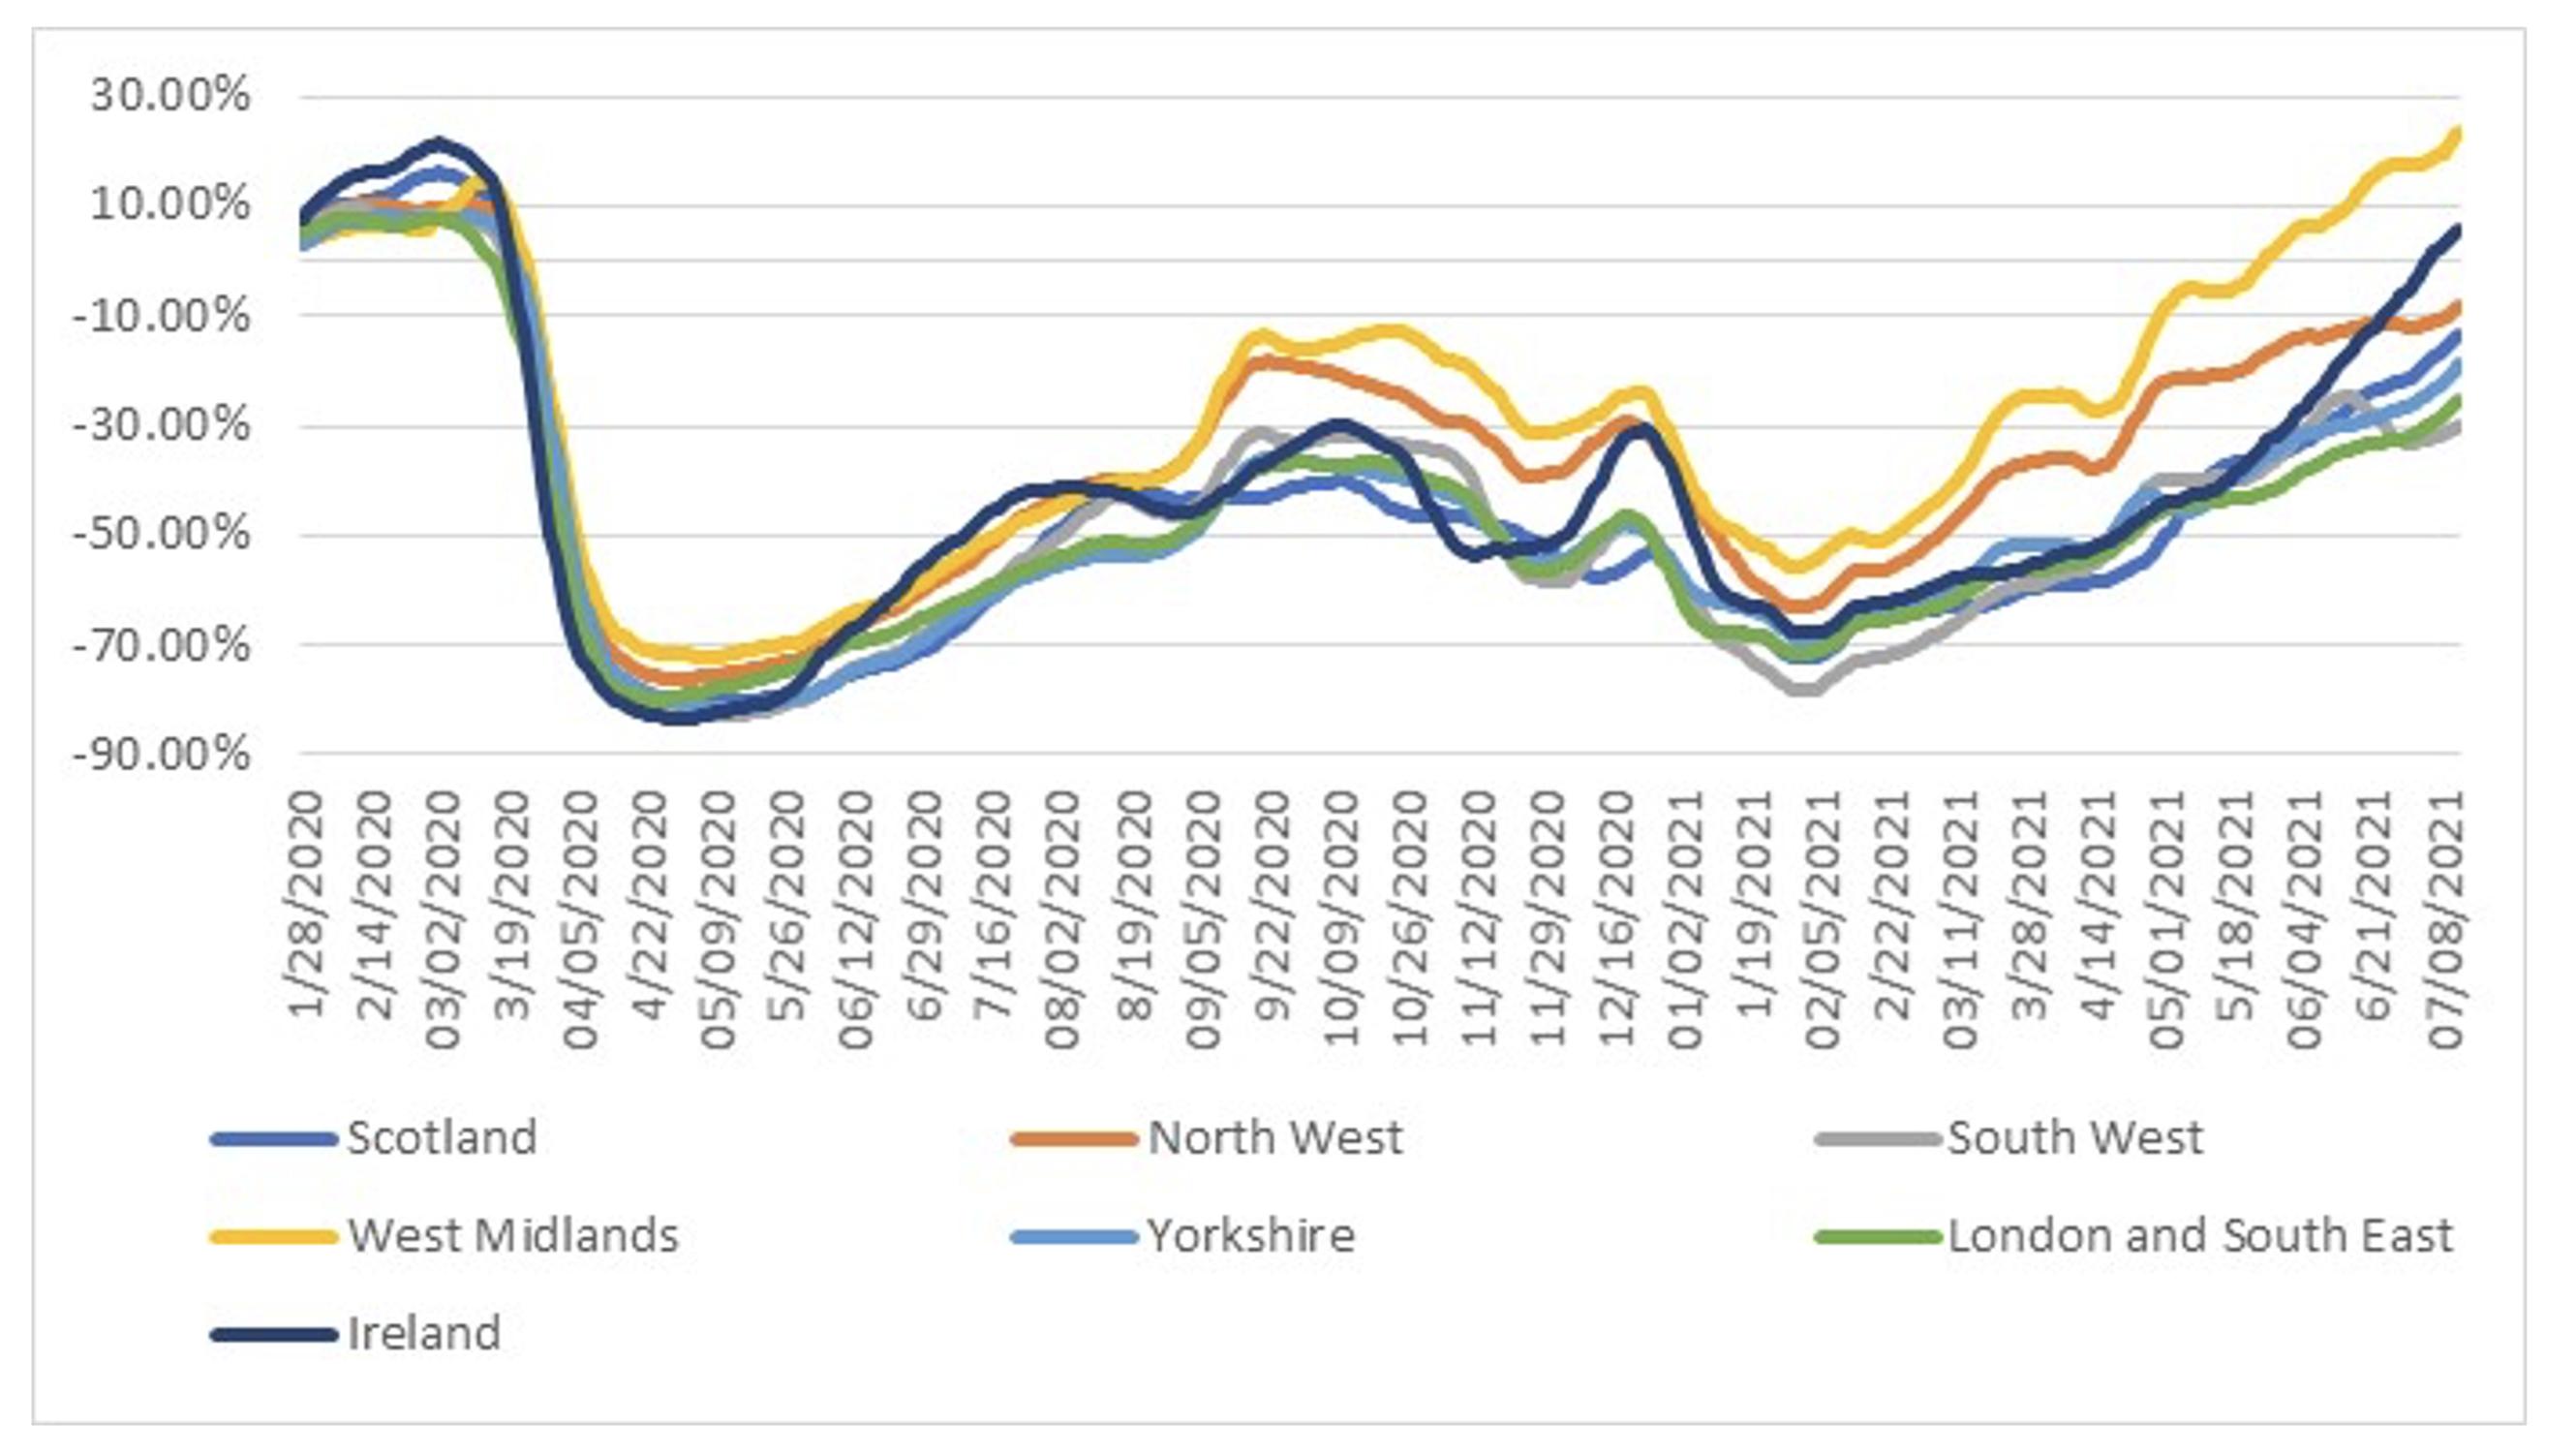
Figure 1 shows usage of the app across the UK and Ireland. While the data is presented at a regional level, in reality it relates to the major cities within those regions and countries. The pattern is a very familiar one, with demand collapsing when the first lockdown was introduced in March 2020, recovering slowly over that summer as restrictions eased, before demand declined again over the winter lockdown.
The bounce back since then has been quicker than in 2020. App usage in the West Midlands this July is higher than pre-pandemic and it has been increasing rapidly in Ireland. However, in most of the rest of England and in Scotland usage is 20-30% below normal.
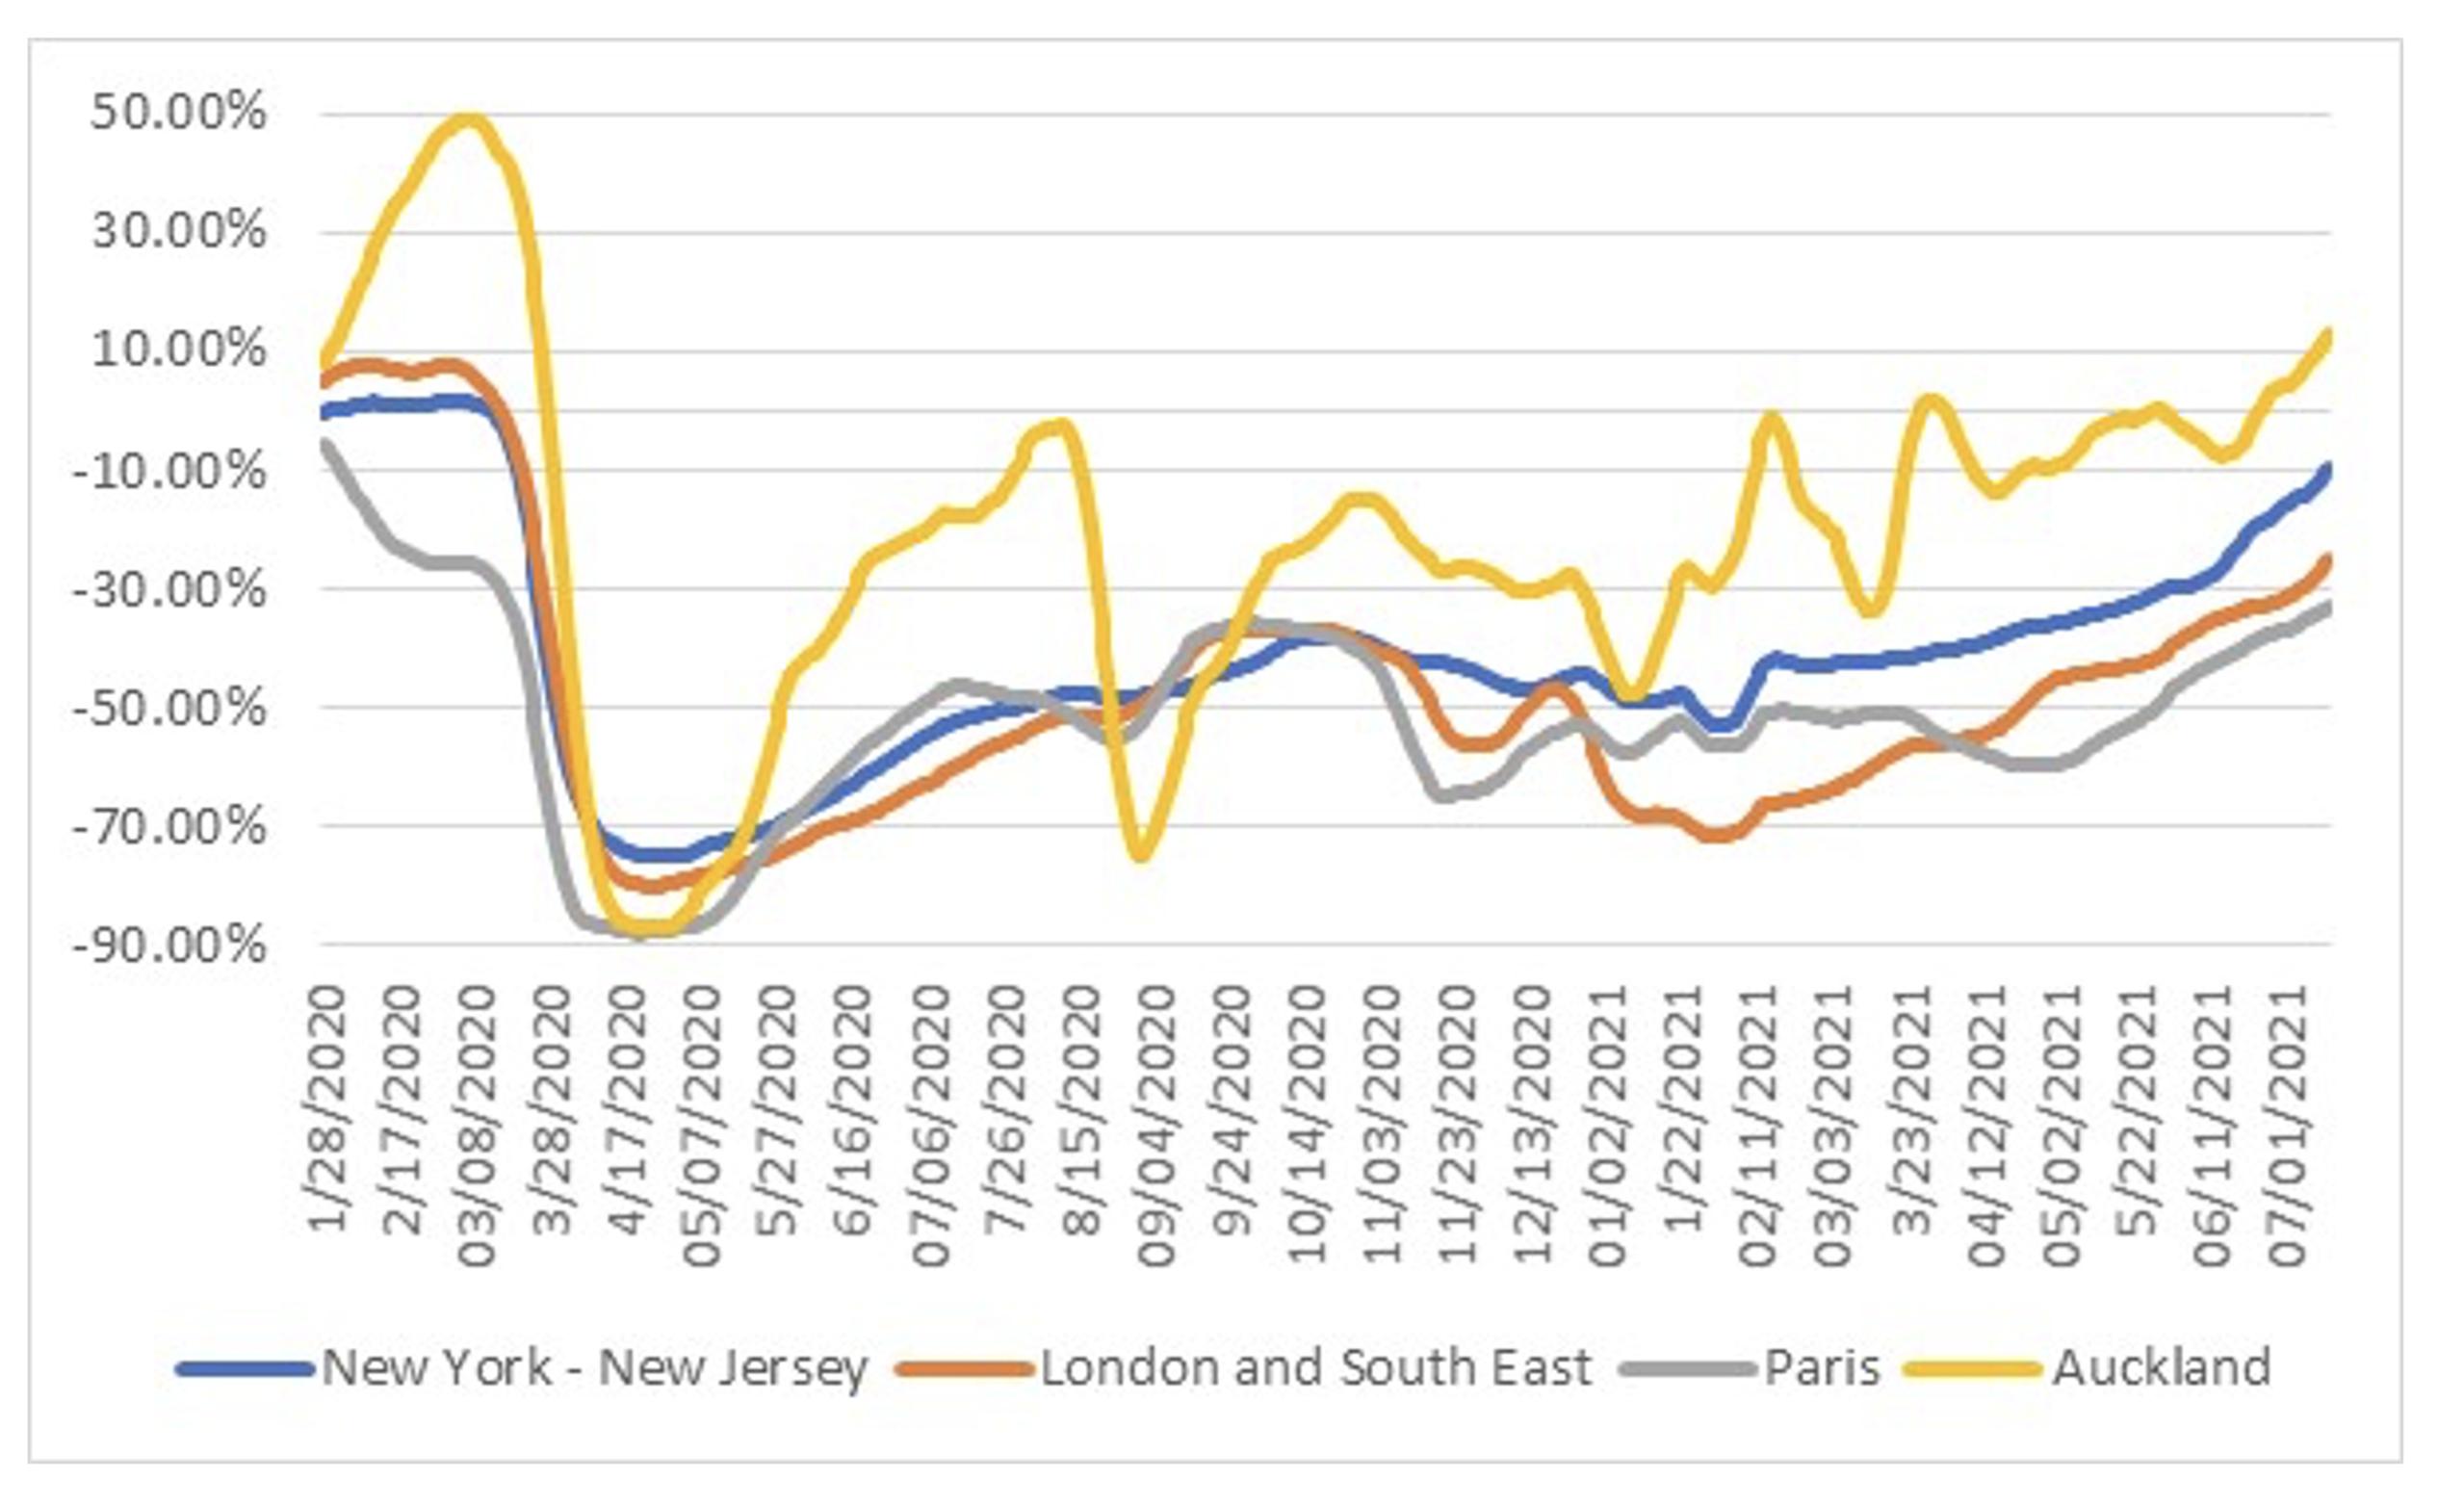
Perhaps of more interest is seeing how the UK compares to other locations around the world. Figure 2 effectively compares London with New York, Paris and Auckland. Continental Europe was hit by the pandemic earlier than the UK and the USA, and Paris closed down quicker than the other cities. However, by April 2020, all four cities had been equally impacted by lockdowns with public transport use collapsing. The patten then starts to diverge. By initially closing its borders and subsequently maintaining tight quarantine controls rapidly, New Zealand brought the pandemic under control. Apart from a few short lockdowns since, Auckland has returned to near normal and, by July 2021, App usage was around pre-pandemic levels.
New York, which was badly hit at the start of the pandemic, did not have a winter lockdown and app usage stayed fairly constant at around 50% of normal levels over the winter, before ticking up in the spring. Since then, it has climbed up to nearly 90% of normal levels. In London, app usage fell more than the other cities during the 2020 winter lockdown, but again has climbed steadily since as the economy re-opens following the successful vaccination programme. While Paris did not experience such a large fall over the winter, it has been slower to recover with usage still 30% down on pre-pandemic levels.
It is clear that public transport use continues to recover and Auckland shows that demand could recover to pre-pandemic levels in the near future. However, it should be noted that recovery has been driven by leisure trips, where people are more likely to use transport apps as they are making less familiar journeys, rather than regular commutes. Even in Auckland peak time public transport rail use, for example, remains way below 2019 levels as the trend to work from home has accelerated.
The future for public transport is perhaps not as bleak as some had envisaged but there is still some way to go.
Figure 2: Use of Moovit App compared to average pre-pandemic usage – 14 day moving average
John Siraut is director of economics at Jacobs
Email: john.siraut@jacobs.com
TransportXtra is part of Landor LINKS
![]()
© 2026 TransportXtra | Landor LINKS Ltd | All Rights Reserved
Subscriptions, Magazines & Online Access Enquires
[Frequently Asked Questions]
Email: subs.ltt@landor.co.uk | Tel: +44 (0) 20 7091 7959
Shop & Accounts Enquires
Email: accounts@landor.co.uk | Tel: +44 (0) 20 7091 7855
Advertising Sales & Recruitment Enquires
Email: daniel@landor.co.uk | Tel: +44 (0) 20 7091 7861
Events & Conference Enquires
Email: conferences@landor.co.uk | Tel: +44 (0) 20 7091 7865
Press Releases & Editorial Enquires
Email: info@transportxtra.com | Tel: +44 (0) 20 7091 7875
Privacy Policy | Terms and Conditions | Advertise
Web design london by Brainiac Media 2020
John Siraut
John Siraut
Economist specialising in the wider economic and social impacts of transport. Worked on Crossrail, Heathrow, London Gateway Port, light rail and tram schemes, buses, roads and parking. Also undertake economic research into areas such as housing, retail, street markets and regeneration generally. Chair of governors at an inner-city London school and a member of the Institute of Economic Development London executive. Specialties: Transport economics, economic development, economic research