The scale of the transport decarbonisation challenge is huge. Back in late June 2021, as the UK awaited the imminent publication of the Government’s Transport Decarbonisation Plan, leading transport and energy academic Professor Jillian Anable pointed out in a webinar that there has been no net reduction in carbon or energy from UK transport since 1990.
It is generally accepted that there are big differences between cities, major towns and peri-urban and rural areas – in the latter, mode shift options may be harder, and there may be less robust data available to counteract assumptions and justify interventions.
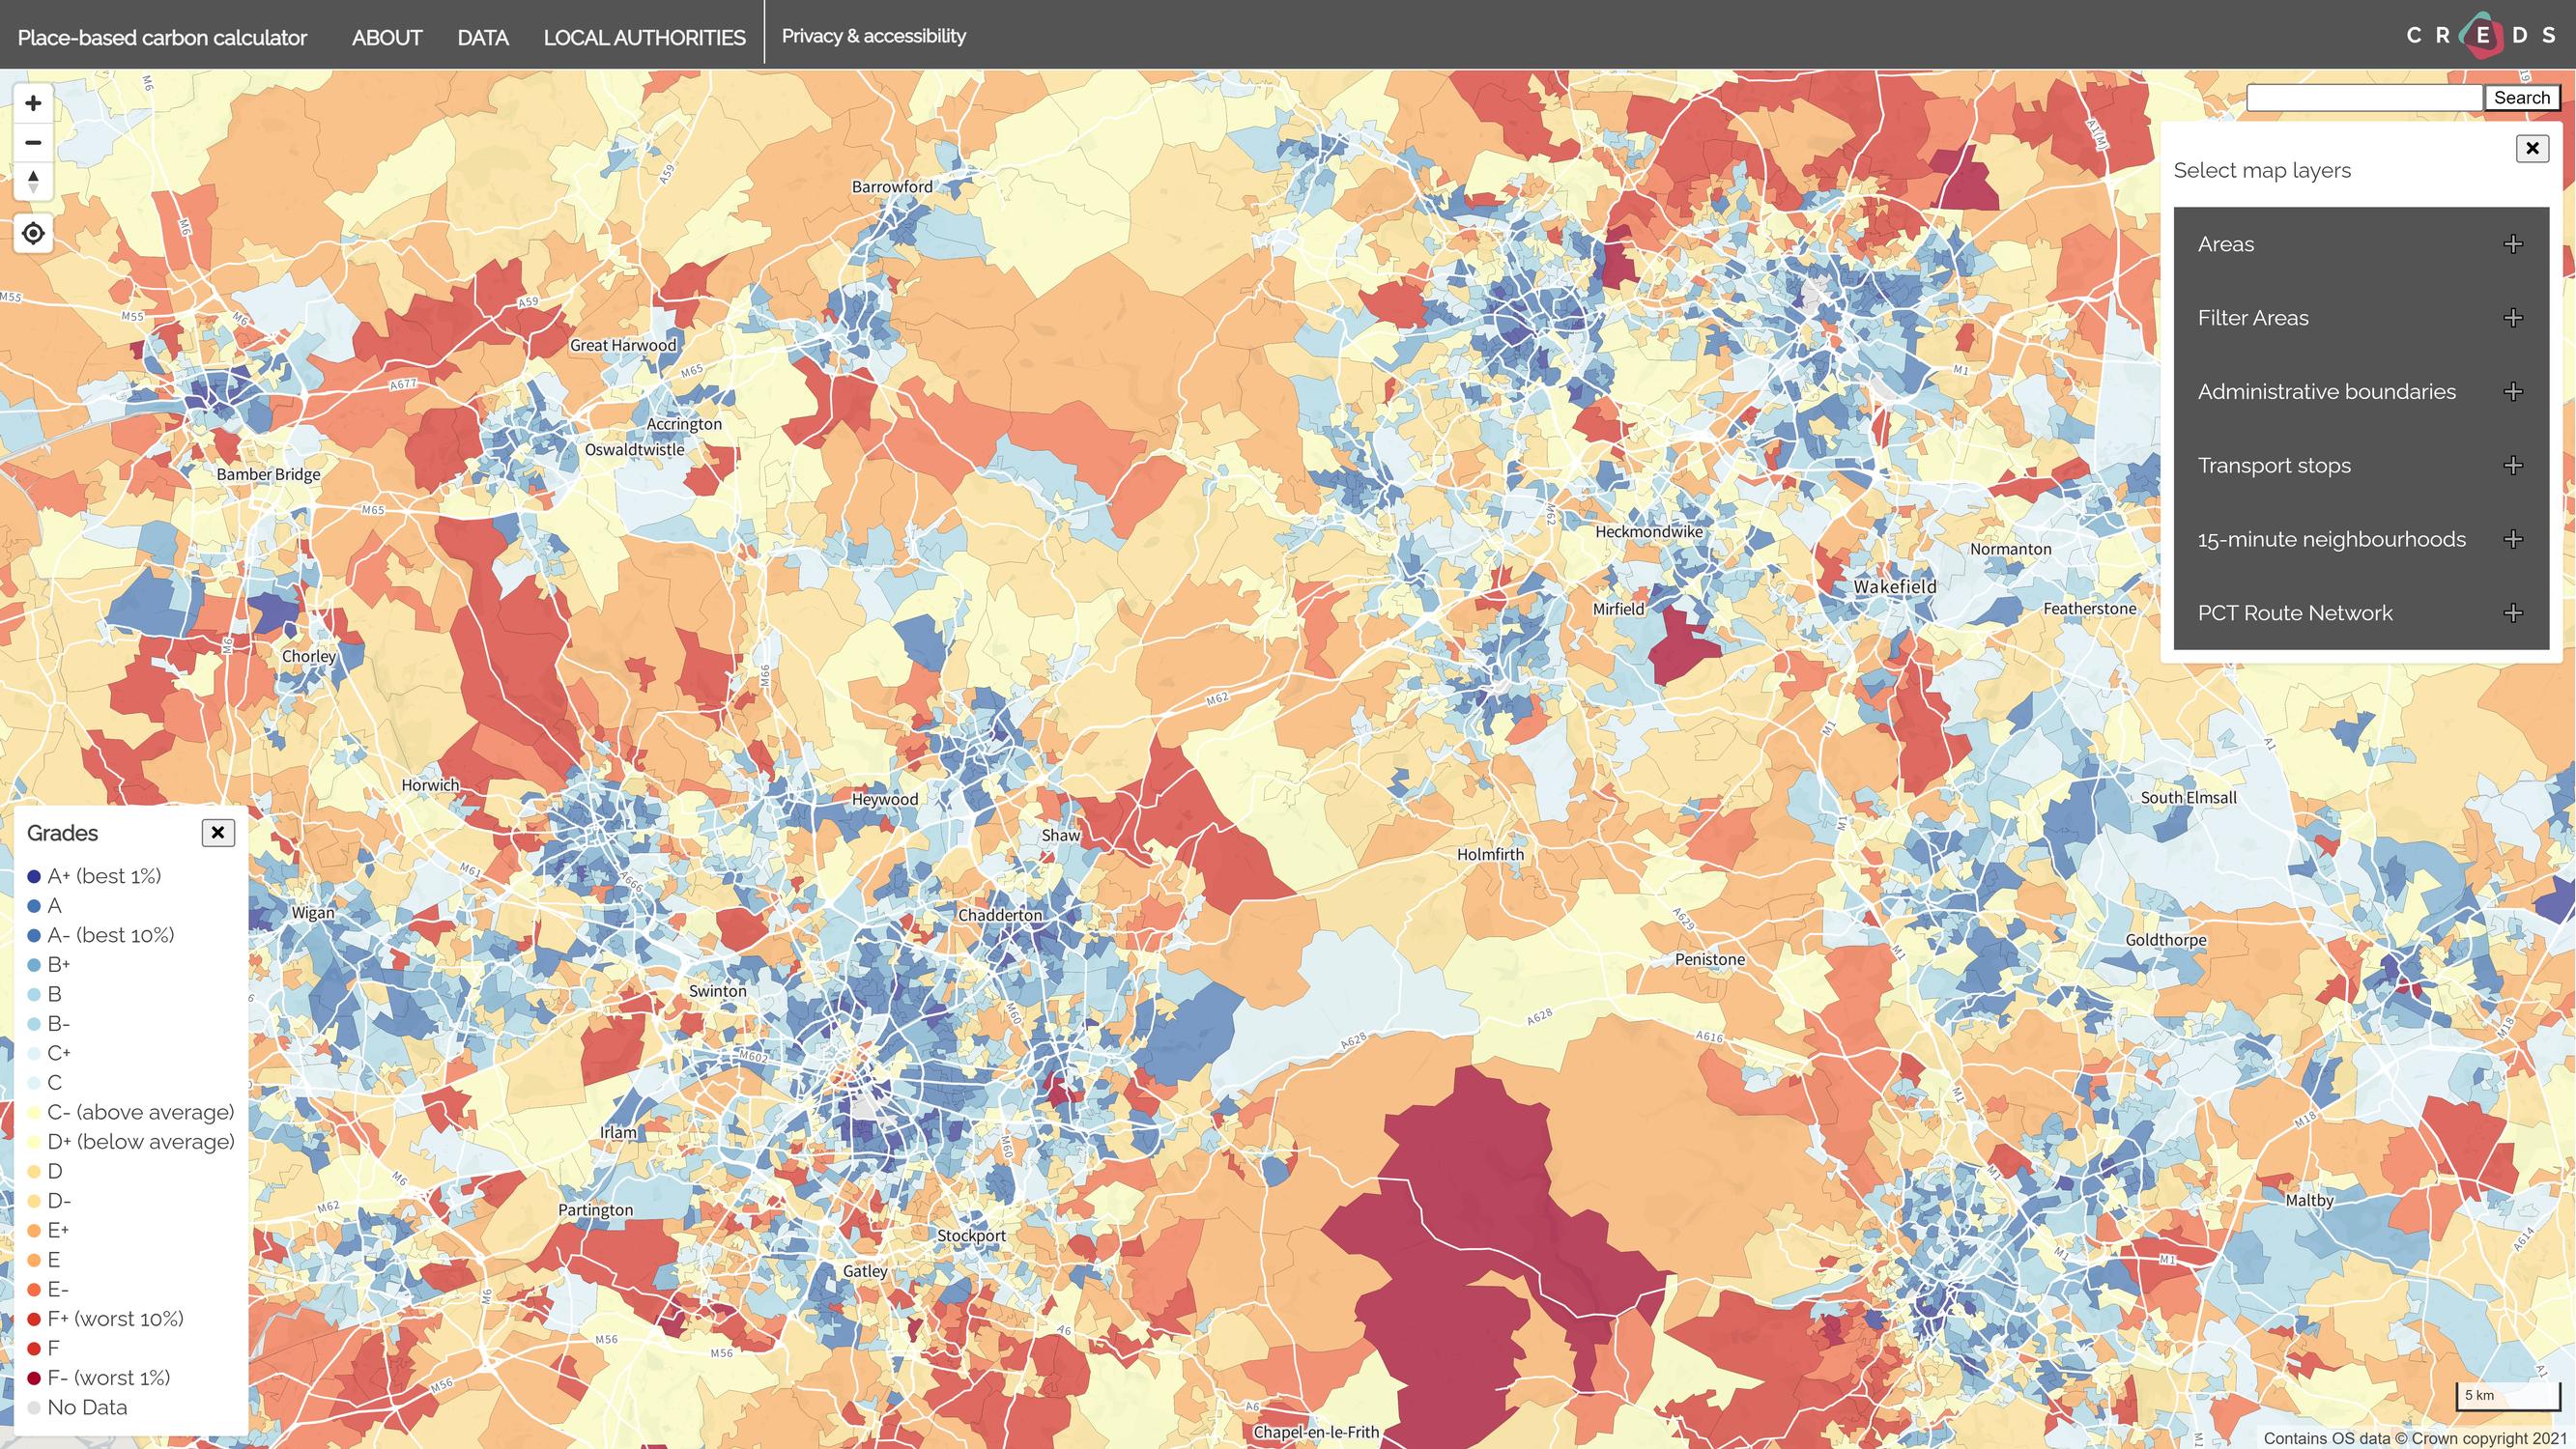
To help clarify the picture, Anable is one of a team of researchers from CREDS, (the Centre for Research into Energy Demand Solutions) that has created a free tool to map the carbon footprint of every neighbourhood in England. The Place-Based Carbon Calculator (PBCC), which was developed with local authority partners at Transport for the South East and at Steer, is an interactive map that enables users to zoom into any street to see a detailed breakdown of carbon footprints and uptake of low carbon technologies, such as how well insulated homes are, public transport levels and accessibility, how people travel to work and school and by what modes, or how far the average resident drives per year.
Speaking at the launch of the PBCC on June 29 2021, she said: “There is a variation of a factor of five between the highest and the lowest carbon emitting districts. There is more to be done in some places than others, but nowhere gets a free pass,” says Anable. “If your local authority starts slowly on its emission reduction pathway, perhaps waiting for EVs to become widespread, it will fail, quickly.”
It is hard enough to think of strategies which will work if they are started now, she added. “I have not seen any analysis which produces a pathway which does not look radical. If your strategy for carbon reduction looks a bit like ‘more of the same’, or simply relies on better choices, then you haven’t got your carbon ambition right. This is a climate emergency.”
The challenge is massive, she says. She cites an extract from the West Yorkshire Combined Authority Emissions Reduction Pathway – one possible future which might be consistent with its 2038 near zero commitment – that shows just how massive, outlining the need for a 21% reduction in private car travel, a 78% increase in walking, a 2000% increase in cycling, a reverse in the declining bus market and rail increases, “for which the capacity does not exist”.
The PBCC is deliberately designed to measure carbon footprints at neighbourhood level. Malcolm Morgan, a CREDS researcher at the University of Leeds, and the developer of the tool, said: “Why do we admonish individuals for choosing the car, when they are often powerless to change their transport environment and make better choices?”
But this is not so for communities, he adds, which have the collective resources and powers to make meaningful change. “A community, usually acting through the local council, can build the needed infrastructure or change the economic and social incentives that not only make a low carbon lifestyle possible, but also the desirable and easy choice.”
“We were able to crunch through the data and produce an average per person carbon footprint for each Lower Super Output Area (LSOA) in England. LSOAs are small statistical areas with an average population of about 1,500-3,000. It turns out that when you look at this scale, carbon footprints vary wildly and in interesting ways. The highest carbon areas have an average per person footprint more than eight times larger than the lowest carbon areas, and the tool provides valuable insights into why the footprints vary.”
We need to be thinking about decarbonising 10 entire neighborhoods per day. For mid-size local authorities, that translates to about one per month
The tool includes walking and cycling and public transport data, and offers a useful 15 minute accessibility layer which highlights what amenities can be reached by 15 minutes of walking, cycling, public transport or a combination of these modes, at different times of the night and day, and enables problem areas to be targeted.
“The issues that local authorities are going to be responsible for in terms of decarbonisation are housing and local transport, and largely this needs to be done by the end of the decade. That means we have about 33,000 of these LSOA neighbourhoods that need to be decarbonised, and only about 3,000 days to do that in.
“So, nationally, we need to be thinking about decarbonising 10 entire by neighbourhoods per day. For mid-size local authorities, that translates to about one neighbourhood per month. So while it’s great that local authorities are starting to think about their 2050 and 2030 plans, it’s actually really important to have a plan for next month, and a plan for tomorrow. Because that's the speed that we need to be moving at.”
Transport for the South East (TfSE), one of seven sub-national transport bodies in England, is a member of the PBCC team. As a case study, TfSE’s Mark Valleley has used the tool to compare a rural district with a population of around 160,000 people in various small towns and villages with a coastal urban area with a population of around 100,000. “It is clear that everyone is starting from a very different place,” he says. The tool shows that the two districts have very different levels of emissions, and it also compares each area to the England average.
“This kind of information is enabling us to think about interaction planning, and to see where we need to plan and prioritise interventions.
“We now see that there’s more home working happening in the rural areas, so in those zones we need to focus less on reducing the need to travel, and instead concentrate on a shift to environmentally-friendly modes. Can we increase the frequency of the existing bus services and get people more people travelling using the bus? Or, given the high levels of car use, should our focus in this rural context be driving EVs as one of the central pillars of what we do?”
The PBCC data is publicly available and free to use, and all the source code that was used for analysis is also published as open source. At the moment, the tool offers a single snapshot from 2018, but the team is hoping to secure additional funding and so be able to continually update the datasets.
TransportXtra is part of Landor LINKS
![]()
© 2026 TransportXtra | Landor LINKS Ltd | All Rights Reserved
Subscriptions, Magazines & Online Access Enquires
[Frequently Asked Questions]
Email: subs.ltt@landor.co.uk | Tel: +44 (0) 20 7091 7959
Shop & Accounts Enquires
Email: accounts@landor.co.uk | Tel: +44 (0) 20 7091 7855
Advertising Sales & Recruitment Enquires
Email: daniel@landor.co.uk | Tel: +44 (0) 20 7091 7861
Events & Conference Enquires
Email: conferences@landor.co.uk | Tel: +44 (0) 20 7091 7865
Press Releases & Editorial Enquires
Email: info@transportxtra.com | Tel: +44 (0) 20 7091 7875
Privacy Policy | Terms and Conditions | Advertise
Web design london by Brainiac Media 2020