Painting a picture of the changing use of our transport system is not easy. A picture composed only of averages or aggregate change amounts to clumsy brush strokes. The finer detail in the picture comes from the artist’s ability to reflect the diversity of components of change – the distributions from which the averages arise. The Department for Transport's latest statistical release, 'Road Traffic Estimates: Great Britain 2017' attempts to paint a picture, including fine detail. Yet the crucial question when looking at the picture is this: what can I see that helps inform how we address future mobility? The danger here is in approaching this question with a mindset of 'what do I want to see in the picture?' Confirmation bias lurks, with a temptation to look for insights in the stats that support and reinforce our preconceptions.
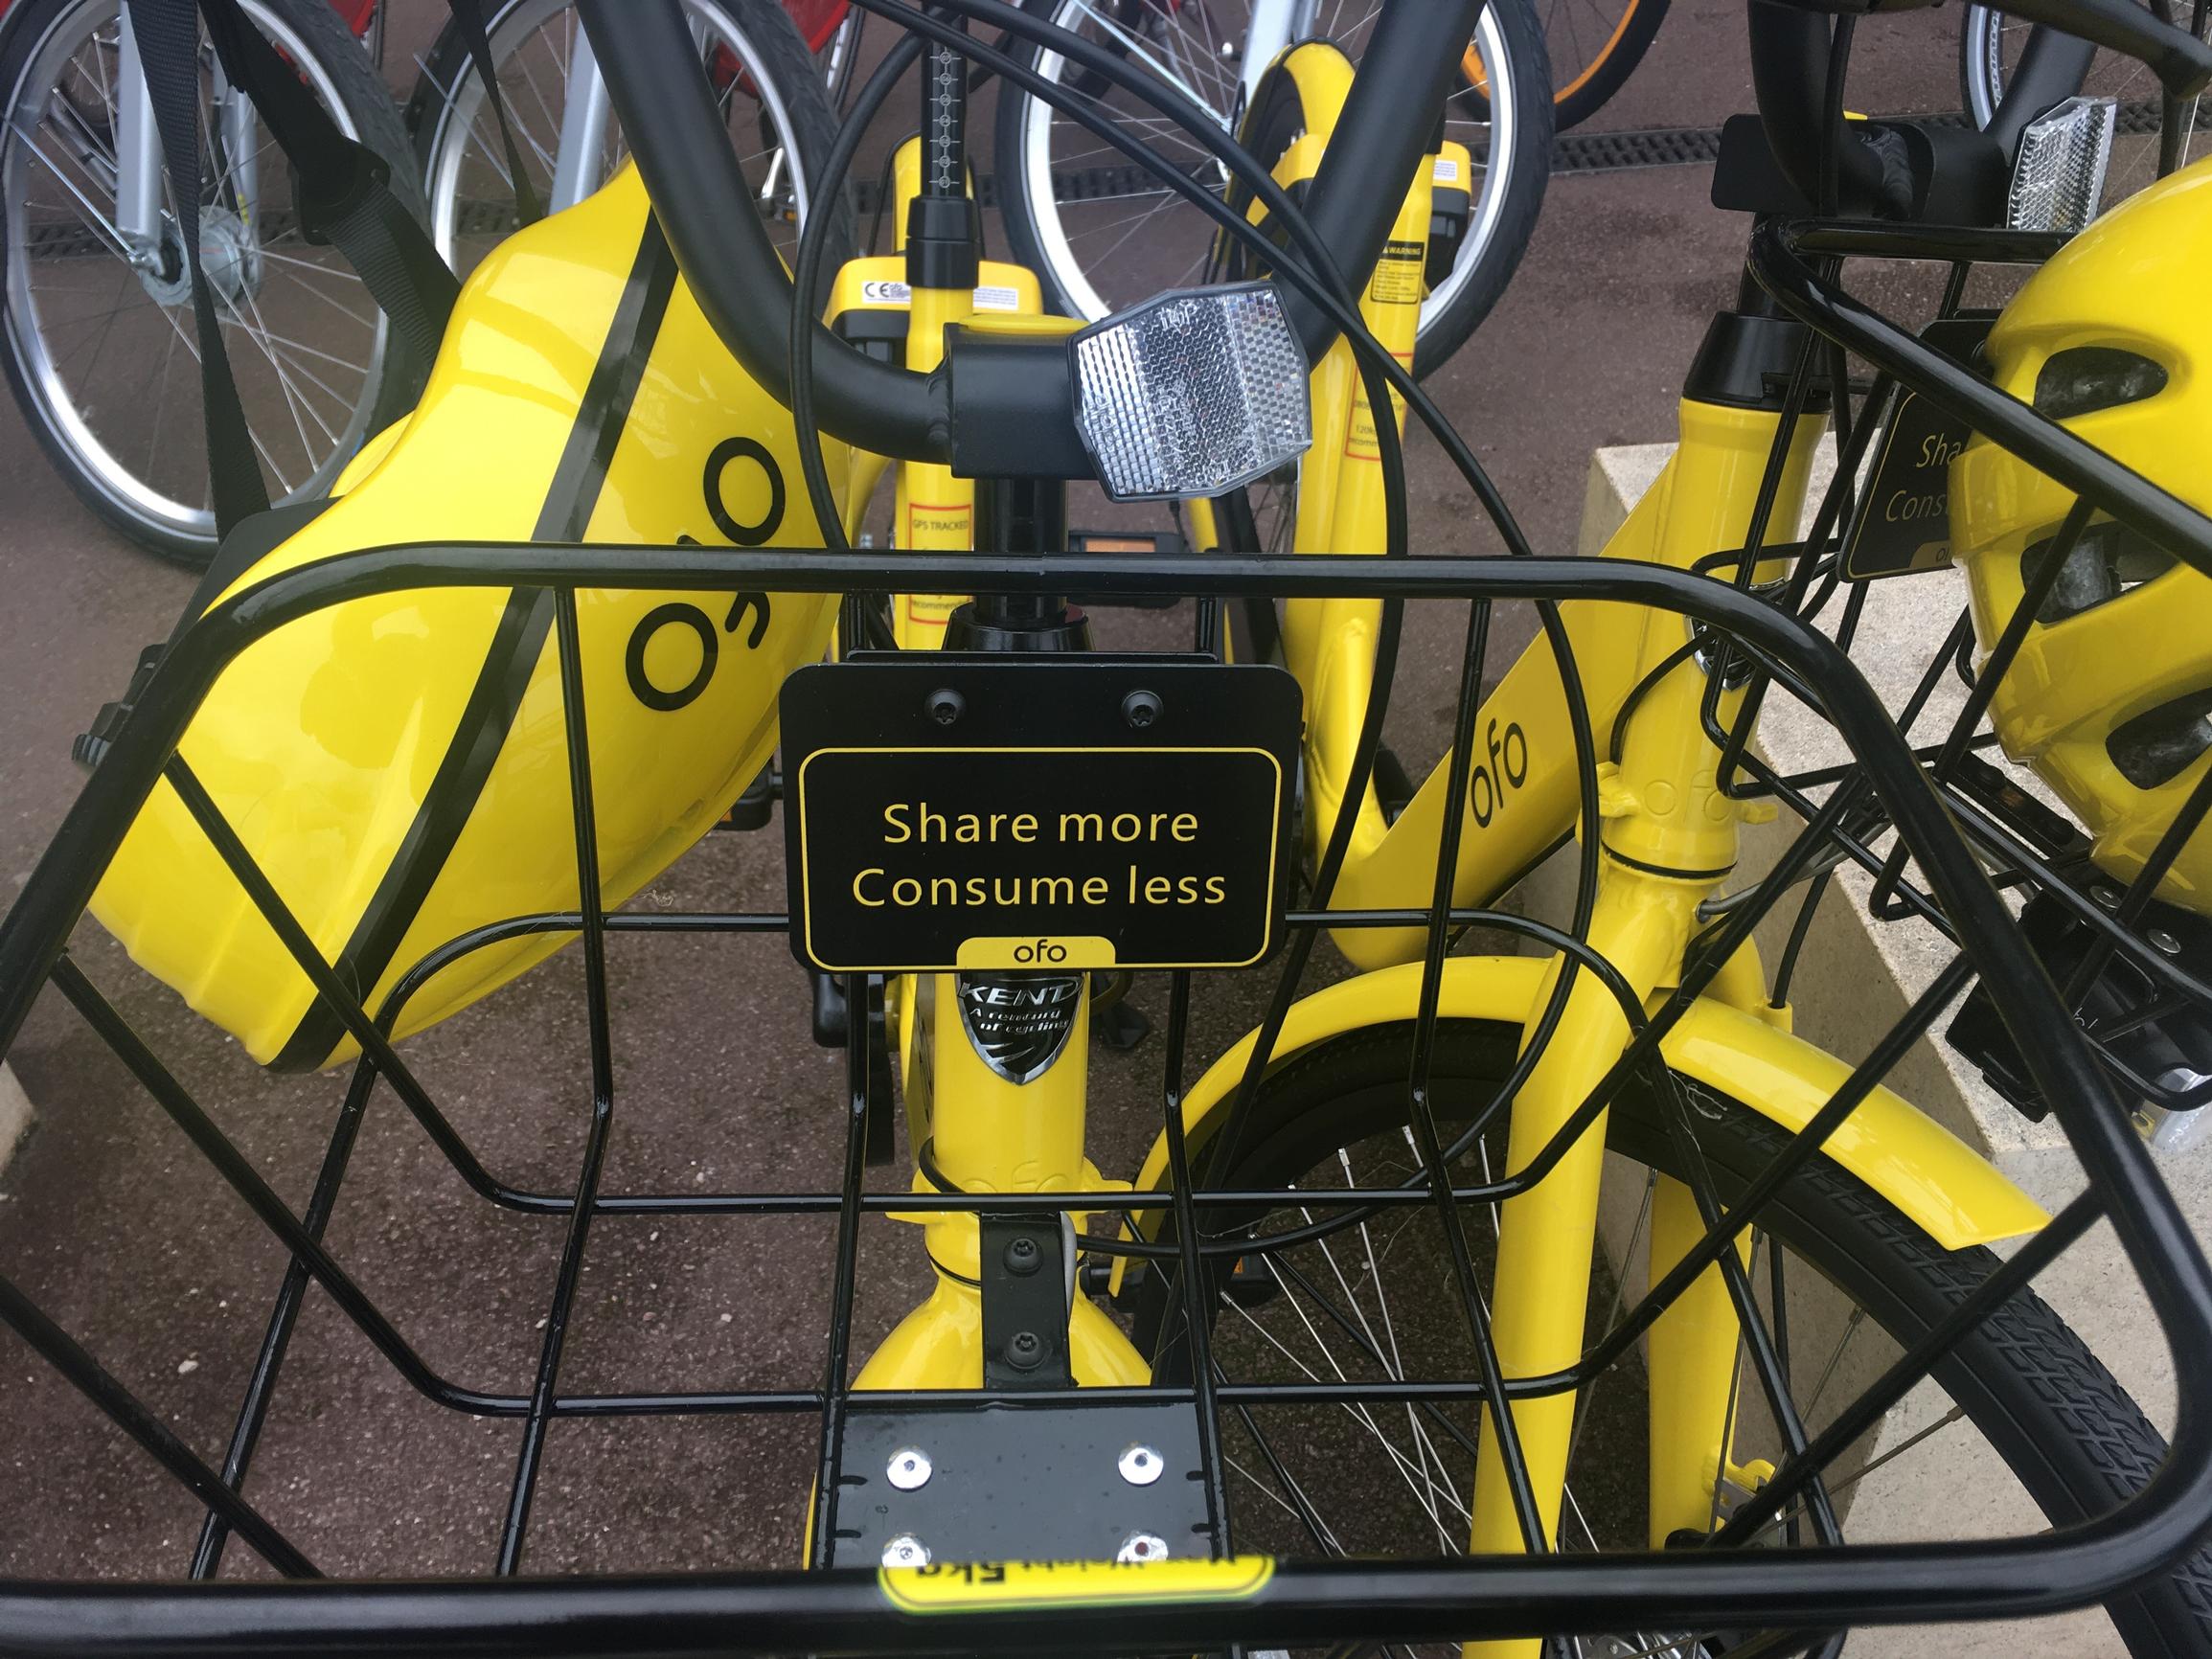
The DfT stats tell us that 2017 recorded the 'highest annual car traffic estimate ever', while the bus, a cornerstone of sustainable transport, took another hit in a trend of overall decline: 'Bus and coach traffic saw the largest decrease of any vehicle type between 2016 and 2017'. Yet the numbers also highlight a renaissance in active travel, with cycle traffic growing by 25 per cent in the last 10 years. The figures also highlight that car and taxi miles travelled have continued to decline on urban A roads – surely significant in an era of urbanisation.
The variability of change across different modes, road types and locations points to multiple dynamics and to the risks inherent in any attempt to generalise. There is an understandably strong wish to know why, over time, changes are taking place. The DfT publication makes a modest attempt at addressing this, but making sense of cause and effect is far from straightforward. There is scope, as a reader, to single out potential connections that may signify cause and effect. For instance, the last three years have seen a resumption of traffic growth but this is also a period that saw 'a marked fall in fuel retail prices'. The reader may have in mind further sources of possible explanation beyond those presented. For instance, the publication does not summarise the Highways England investment programme (including a Smart Motorways initiative working towards the addition of 480 lane miles of extra capacity).
Population growth is an important explanatory factor for road traffic, which the DfT rightly acknowledges. In terms of road traffic growth, it identifies three decades of growth in vehicle miles travelled: 1980s – 50%; 1990s – 14%; 2000s – 6%. For the same three decades, ONS data suggests the following corresponding growth in population (for the UK): 1980s – 1.6%; 1990s – 2.9%; and 2000s – 6.5%. In short, we have witnessed a growth rate over three decades that increases for population yet declines for traffic. Accordingly, the DfT notes a declining trend in per capita car miles from 2002 to 2013 (but with signs of a slowing, or reversal, from 2013 onwards).
What overall message might be taken from examining these DfT figures? For me, there comes a reminder that the regime of automobility – society’s dependence upon the car at an aggregate level – continues to make its presence strongly felt. However, the slowing of road traffic growth in the face of a quickening in population growth over the last three decades suggests a regime that may be tiring, and subject to instability. We need to take a much closer look at the heterogeneity of society to judge where we might be seeing the signals of future change. Alongside Greg Marsden’s report, the recent DfT study into young people’s travel behaviour, led by my UWE Bristol colleague Kiron Chatterjee, is an important case in point . One insight from this report that stuck in my mind was the following: “29% of all 17-20 year olds had a full driving licence in 2014 compared to 48% in 1992/94”. This is surely a powerful dynamic playing through into future road traffic estimates (unless, of course, a driving licence becomes immaterial in an autonomous future scenario). I look forward to discussions on these issues, and more, at Smarter Travel LIVE!
TransportXtra is part of Landor LINKS
![]()
© 2026 TransportXtra | Landor LINKS Ltd | All Rights Reserved
Subscriptions, Magazines & Online Access Enquires
[Frequently Asked Questions]
Email: subs.ltt@landor.co.uk | Tel: +44 (0) 20 7091 7959
Shop & Accounts Enquires
Email: accounts@landor.co.uk | Tel: +44 (0) 20 7091 7855
Advertising Sales & Recruitment Enquires
Email: daniel@landor.co.uk | Tel: +44 (0) 20 7091 7861
Events & Conference Enquires
Email: conferences@landor.co.uk | Tel: +44 (0) 20 7091 7865
Press Releases & Editorial Enquires
Email: info@transportxtra.com | Tel: +44 (0) 20 7091 7875
Privacy Policy | Terms and Conditions | Advertise
Web design london by Brainiac Media 2020