It wasn’t so long ago that getting access to bus timetable and route information for a transport model was an arduous task.
Sometimes data was available via the local transport authority, but would need to be translated into modelling software, sometimes data would be of varying quality depending on the bus operator, and sometimes data was missing altogether and would need to be coded manually.
This fragmentation of data provision made the modelling of bus services a non-trivial process. However, in 2017 the Bus Services Act mandated that all bus timetables, routes, live locations, and fares data be provided and made available through the government’s BODS (Bus Open Data Service) portal by the end of 2020.
With this comprehensive dataset in place, I take a look at how it can be used to build a simple supply model, enabling detailed analysis and insight within a couple of hours.
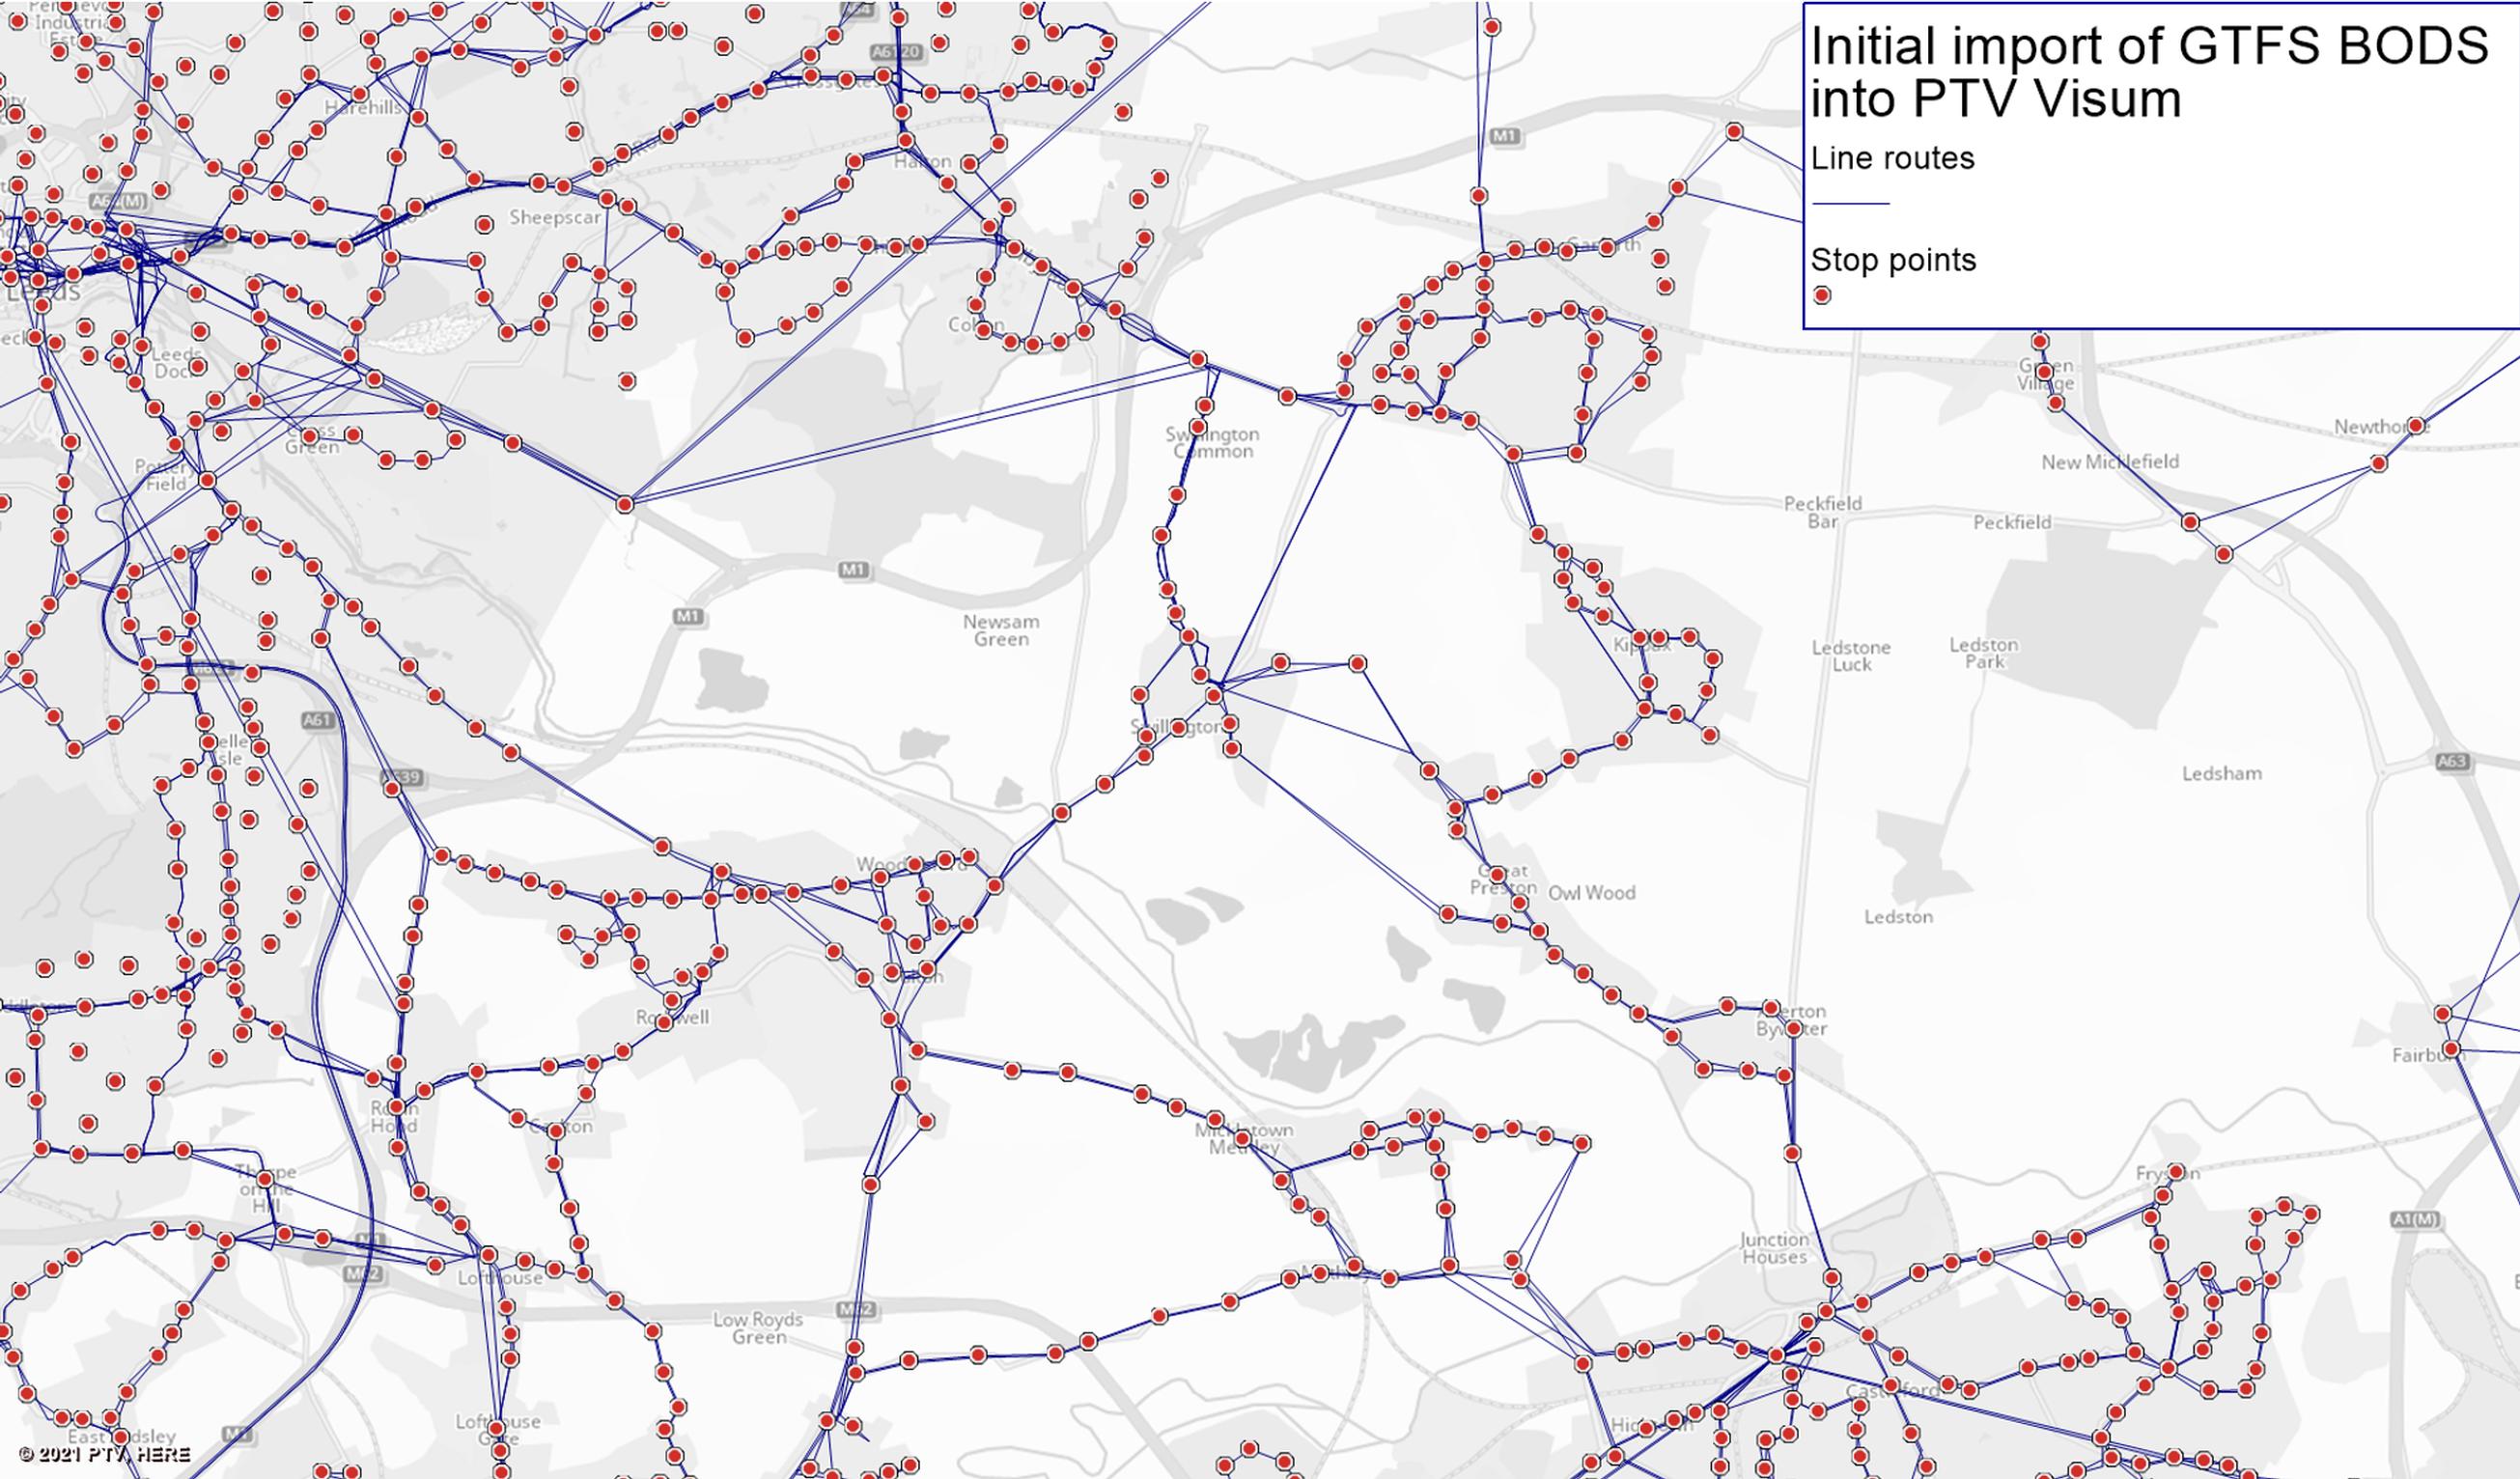
As an example, I’ve downloaded GTFS format timetable and route data for the whole West Yorkshire region.
Data is available as a bulk download nationally or regionally and can also be requested through API, allowing users to return a customisable set of routes. GTFS data is a “specification that allows public transit agencies to publish their transit data in a format that can be consumed by a wide variety of software applications” (GTFS.org).
In addition to timetables and fares, BODS provides live bus location data up to every 5 minutes
The BODS GTFS data provides bus routes with stop to stop coordinates and some road shape information, but no other data about road type or topography.
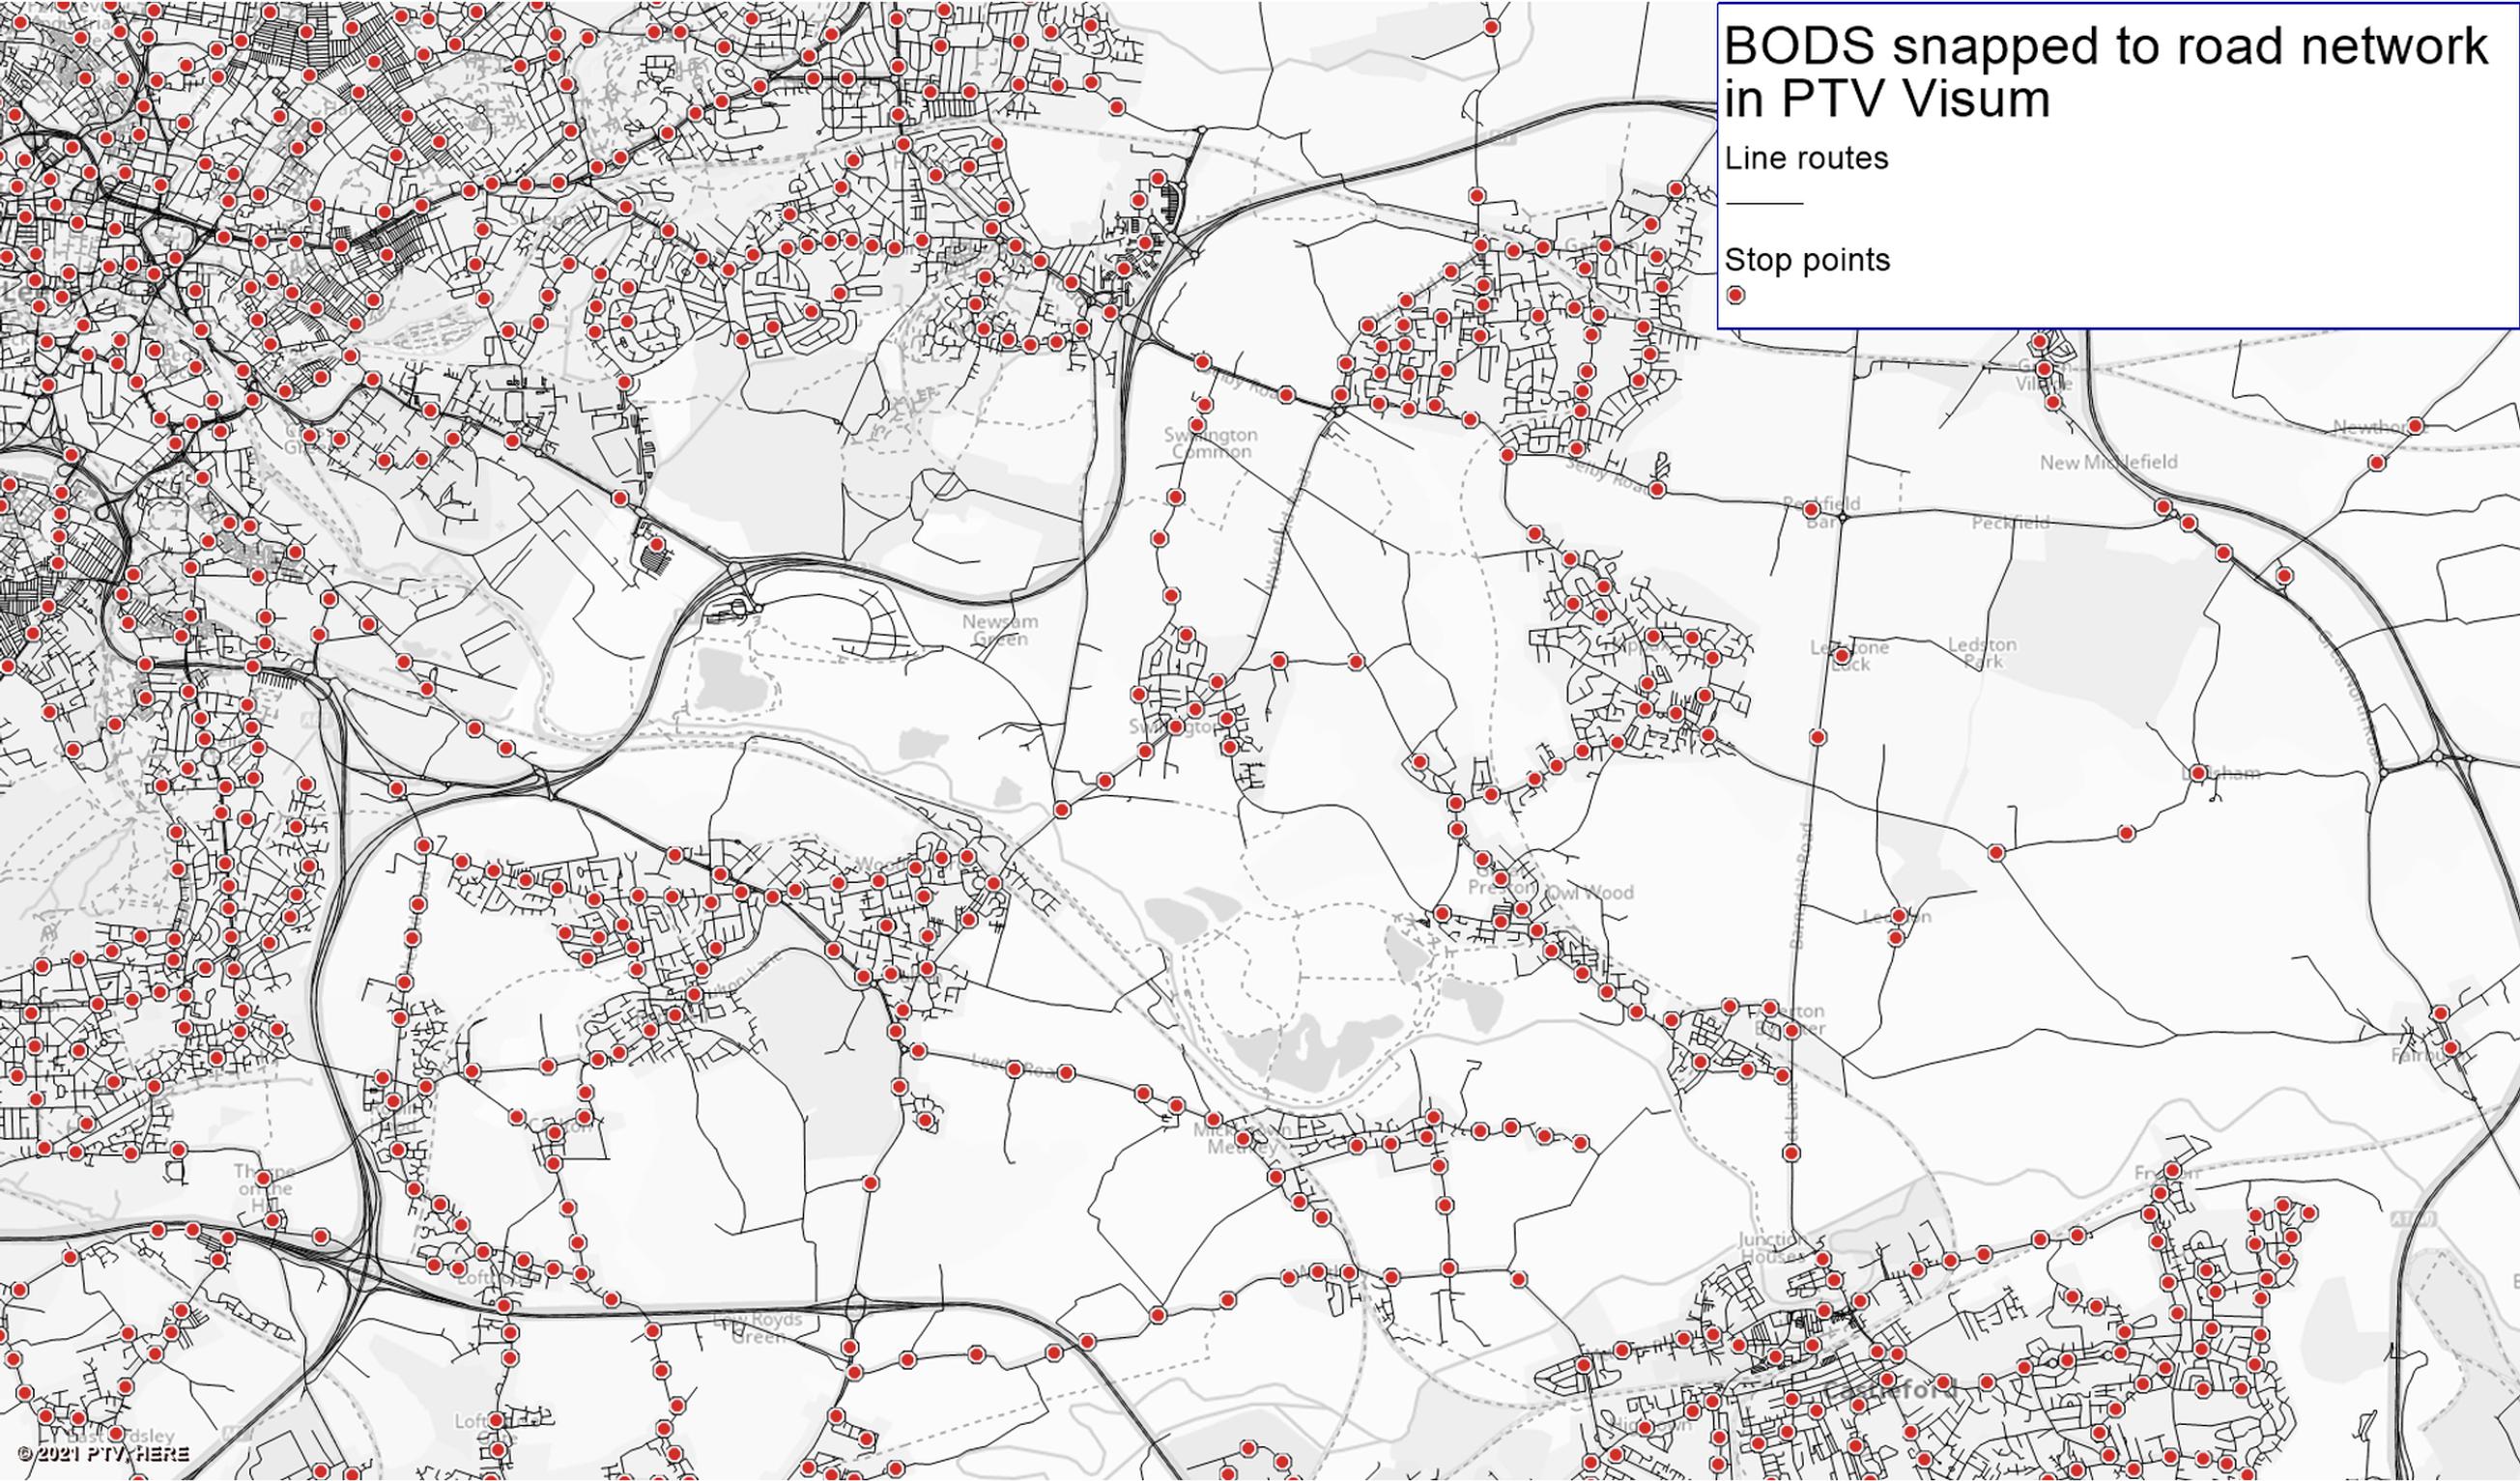
An initial import of this data into a transport modelling software package – in this case PTV Visum – shows straight line bus routes between stops. Fortunately, a built-in PT importer provides a mechanism for bus routes to be snapped onto an existing road network. In this case I’ve used OpenStreetMap (OSM) as a base layer, but any other network layer would also work.
And there it is. A full bus service supply model in a couple of steps. If you wanted, you could also import fare information from BODS. This comes in a NeTEx format and can be processed by most programming software and matched to the timetable data.
Fares obviously vary across the country and between operators, but this data is broken down by service, ticket type, and day purchased. The modeller can therefore decide how to apply this in their model: stop to stop, disaggregated by time of day, or simply approximated with a distance calculator.
In addition to timetables and fares, BODS provides live bus location data up to every 5 minutes. This can be used to assess journey time reliability by comparing to the fixed timetables.
If the data is also integrated into a multi-modal model, the impact of congestion on bus reliability can be understood in more detail. As well as historical comparisons of reliability, the data can also be pushed into real-time modelling systems – such as PTV Optima – allowing traffic management operators to see and react to bus and road delays in real time.
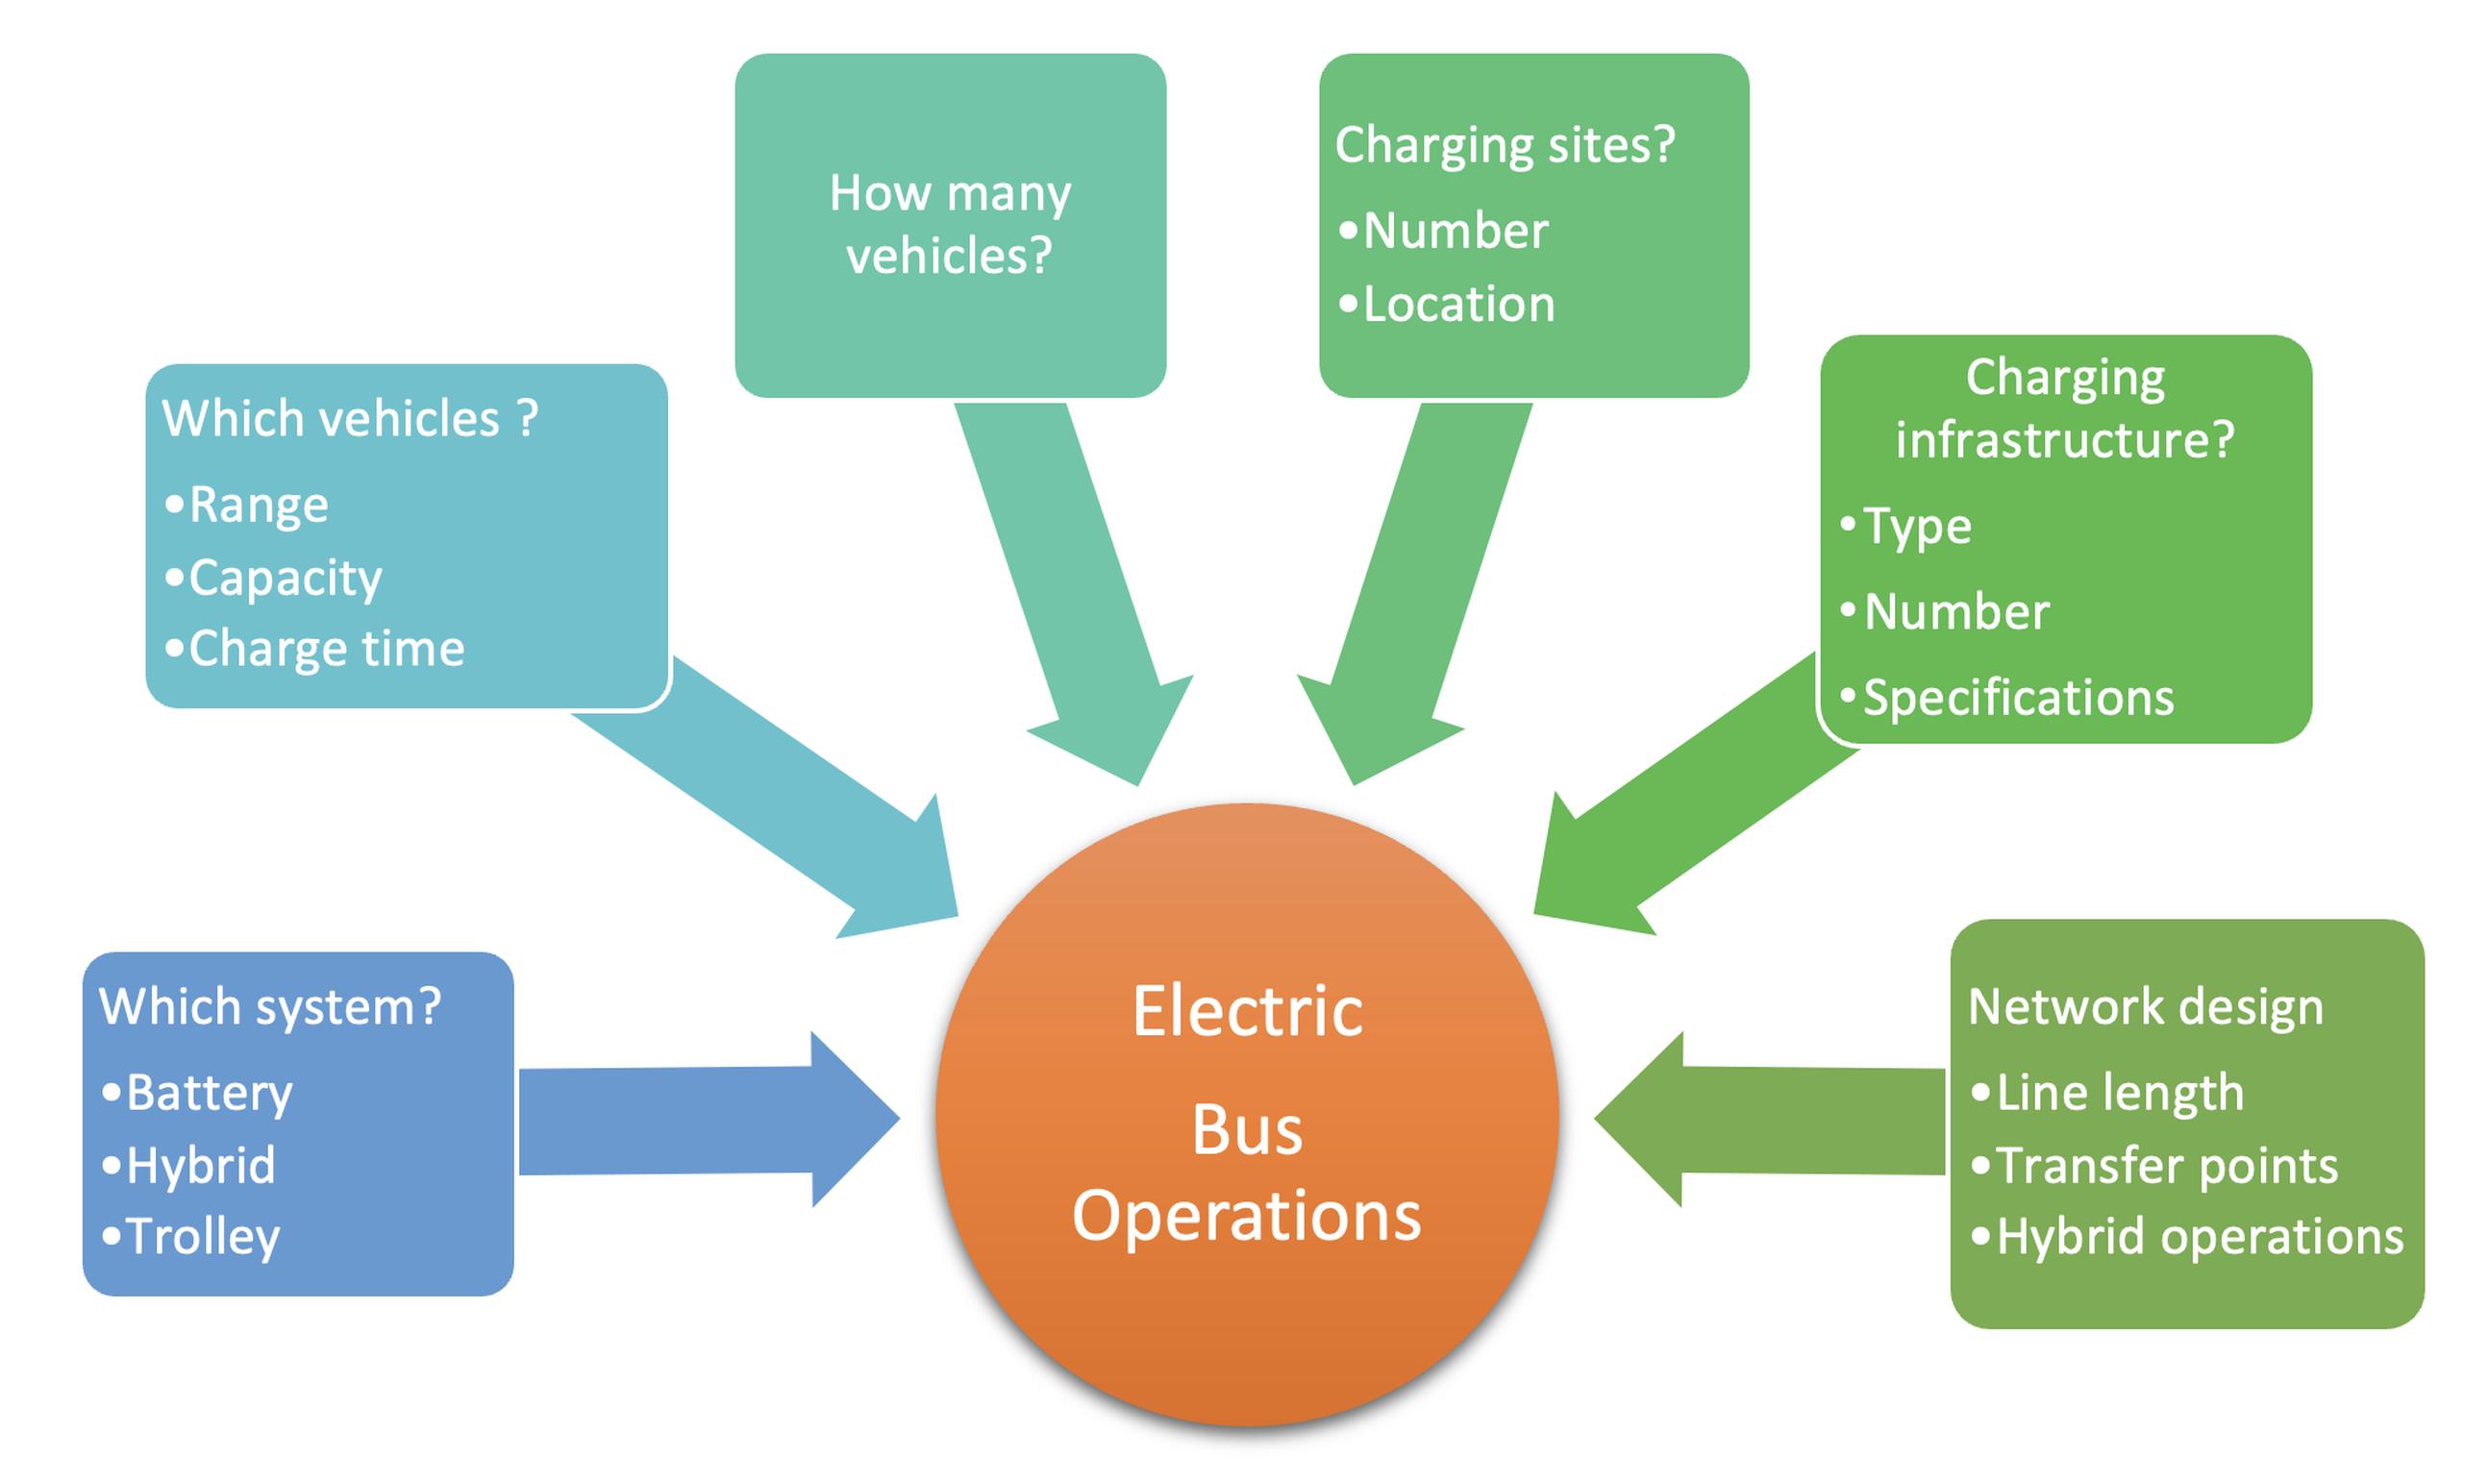
Distance considerations and charging requirements have a direct impact on vehicle-to-timetable allocations and running costs
Transitioning to electric buses with the help of BODS
Following on from the COP26 climate summit in Glasgow, a renewed emphasis is being placed on the transport sector to clean up its act and decarbonise as fast as possible.
Although buses are only responsible for a small fraction of transport carbon emissions, their per vehicle emissions are among the highest on our roads and with many existing fleets running diesel buses, high particulate emissions contribute towards poorer air quality in our towns and cities.
Recognising that support was needed, earlier this year the government announced the first two winners of funding for all-electric bus cities in Coventry and Oxford. For many bus operators and transport authorities, running an electrified fleet is a new challenge.
Although battery range has improved significantly in the last few years, distance considerations and charging requirements have a direct impact on vehicle-to-timetable allocations and running costs, which in turn affect how the service should be run if electric.
Fortunately, understanding the interactions between the factors in the image (below, right) can be supported with transport modelling techniques which only require a network imported via BODS.
To demonstrate this, we have used the e-bus optimisation tool within PTV Visum to simulate the conversion of 11 high-frequency bus routes between Leeds and Bradford in Yorkshire. With the existing diesel fleet in operation, the tool calculates that 69 vehicles are required to run the current services.
For the conversion to electric, several options can be considered. You can specify a depot location – in our case the existing depot in Bradford – and input the option for buses to charge there (you can set the envisaged number of charging units and their power rate too if wanted).
The impact of these choices can then be simulated in the tool. This test immediately helps you establish whether the proposal is feasible or not, in this case 72 electric buses would be needed to run the services, making use of 20 charging units installed at the depot.
Having to purchase an additional three vehicles obviously comes with a significant extra cost, so in addition to the depot location we tested what the outcome would be if a high-power charging unit could be installed on a main road into Pudsey.
With this additional charging option available we found it would be possible to run the fleet with 69 electric buses and, because electric buses are much cheaper to run than their diesel counterparts, the operating costs were lower too.
As more and more operators consider switching to electric buses, the ability to plan these services is crucial to help understand operations, evaluate costs, and identify charging options. And with the use of BODS data, such tests can be quickly set up and tested anywhere in the country.
Laurence Chittock is Associate Transport Modeller, PTV GROUP
TransportXtra is part of Landor LINKS
![]()
© 2026 TransportXtra | Landor LINKS Ltd | All Rights Reserved
Subscriptions, Magazines & Online Access Enquires
[Frequently Asked Questions]
Email: subs.ltt@landor.co.uk | Tel: +44 (0) 20 7091 7959
Shop & Accounts Enquires
Email: accounts@landor.co.uk | Tel: +44 (0) 20 7091 7855
Advertising Sales & Recruitment Enquires
Email: daniel@landor.co.uk | Tel: +44 (0) 20 7091 7861
Events & Conference Enquires
Email: conferences@landor.co.uk | Tel: +44 (0) 20 7091 7865
Press Releases & Editorial Enquires
Email: info@transportxtra.com | Tel: +44 (0) 20 7091 7875
Privacy Policy | Terms and Conditions | Advertise
Web design london by Brainiac Media 2020