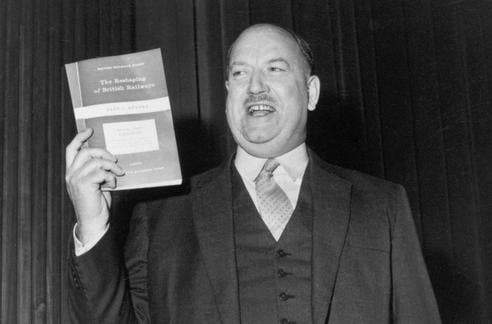
1 Linked Article:
- Station usage: a fascinating insight 14 Feb 2011
More articles like this...
Integration, Stations/Interchanges, TOCs, All of UK
Station usage analysis – part II
John Siraut, Director - Economics, Colin Buchanan
In all the analysis undertaken using the station usage data published by the ORR I have yet to see anything on rail use by head of population. The ORR helpfully categorises every station by a number of spatial levels ranging from Government Office to unitary authority although they have not kept pace with the latest council changes. Whilst there is a fundamental issue that rail usage in some locations is inflated because certain locations, especially the inner London boroughs, receive a lot of inward commuters (or have other attractions such as airports), it is still a useful indicator of rail’s importance across the country.
The analysis set out here is based on unitary authorities split up into four groups based on their population but excluding London boroughs. The population groups are; over 400,000, 200-400,000, 100-200,000 and under 100,000.
So starting out with those unitaries with a population of over 400,000; rail usage per person ranges from 15.2 trips a year in Kirklees to over a 100 in Liverpool and Glasgow. Manchester achieves double the figure for Leeds which in turn is double that of Sheffield. Some cities obviously have a far more intensive rail network than others but it is perhaps still surprising that Edinburgh achieves a higher rail usage figure than Leeds or Birmingham given their respective rail services.
Table 1: Rail use per head of population – unitaries >400,000
| Glasgow | 106.7 |
| Liverpool | 106.2 |
| Manchester | 74.6 |
| Edinburgh | 47.9 |
| Birmingham | 46.9 |
| Leeds | 35 |
| Bradford | 24.6 |
| Bristol | 20.5 |
| Sheffield | 17.8 |
| Kirklees | 15.2 |
Taking those local authorities with a population of between 200,000-400,000 again shows some interesting differences across the country. Discounting those authorities such as Sunderland and Trafford that are principally served by trams/light rail and Oldham which lost its rail service during the year (being converted to a Manchester Metrolink service); rail usage ranges from 4 to 75 trips per person a year. The ten authorities with the highest rail use are shown in table 2. Interestingly they are spread across the country including Merseyside, the Glasgow commuter belt, West Midlands, Cardiff and the South Coast.
Table 2: Rail use per head of population (ten highest) – unitaries 200 – 400,000
| Brighton & Hove | 74.9 |
| Sefton | 63.5 |
| Wirral | 59.5 |
| Cardiff | 50.1 |
| Solihull | 39.3 |
| Medway | 34.5 |
| Portsmouth | 32.9 |
| Southampton | 26.2 |
| Newcastle Upon Tyne | 25.2 |
| South Lanarkshire | 24.4 |
At the other end of scale there are perhaps some surprising entries amongst the authorities with the lowest rail usage. Whilst it is no surprise to see the rural areas of Aberdeenshire, North Somerset and the East Riding of Yorkshire in the list, the inclusion of authorities in the West Midlands, South Yorkshire and Greater Manchester might be. In part this reflects the patchy rail network in some of our largest city regions.
Table 3: Rail use per head of population (ten lowest) – unitaries 200 – 400,000
| Aberdeenshire | 4.0 |
| Walsall | 4.0 |
| Rotherham | 4.4 |
| Dudley | 6.8 |
| East Riding of Yorkshire | 6.9 |
| Kingston Upon Hull | 8.2 |
| Stoke-on-Trent | 8.6 |
| North Somerset | 8.9 |
| Plymouth | 9.0 |
| Salford | 9.2 |
Moving down in size to those authorities with a population between 100-200,000, those authorities with the highest rail use per person are now firmly in the London commuter belt. Crawley, which contains Gatwick Airport, stands out from the rest.
Table 4: Rail use per head of population (ten highest) – unitaries 100 – 200,000
| Crawley | 165.1 |
| Reading | 97.4 |
| Elmbridge | 89.3 |
| Southend-on-Sea | 78.5 |
| Guildford | 78.0 |
| St. Albans | 65.9 |
| Cambridge | 63.3 |
| Mid Sussex | 62.1 |
| Windsor and Maidenhead | 6.7 |
| Reigate and Banstead | 57.1 |
Ignoring Gateshead, which is served by the Tyne and Wear Metro and Epping Forest which is served by the London Underground, those authorities with the lowest level of rail use in this population band tend to have few rail services to begin with and tend to be fairly rural locations.
Table 5: Rail use per head of population (ten lowest) – unitaries 100 – 200,000
| Powys | 3.5 |
| North Lincolnshire | 3.1 |
| East Lindsey | 3.0 |
| Hinckley and Bosworth | 2.6 |
| Rushcliffe | 2.1 |
| Broadland | 2.0 |
| Mendip | 1.1 |
| Newcastle-under-Lyme | 0.8 |
| Vale of White Horse | 0.7 |
| Gedling | 0.6 |
Moving on to the smallest authorities, those with a population less than 100,000 the highest levels of rail usage per head of population are again found in the London commuter belt with one representative from Glasgow’s commuter belt.
Table 6: Rail use per head of population (ten highest) – unitaries <100,000
| Woking | 101.8 |
| Epsom and Ewell | 85.7 |
| Brentwood | 82.4 |
| Uttlesford | 79.5 |
| Tandridge | 61.1 |
| Mole Valley | 58.0 |
| Dartford | 57.8 |
| Hertsmere | 56.4 |
| Watford | 55 |
| West Dumbartonshire | 51.4 |
The smaller authorities with the lowest rail use are an interesting mix. They include Corby which for a long time claimed to be the largest town in Britain without a rail service. The reinstated service has led to a reasonable level of rail use but it is still relatively low. The other locations are fairly rural in nature but are spread across the country.
Table 7: Rail use per head of population (ten lowest) – unitaries <100,000
| South Northamptonshire | 0.4 |
| Staffordshire Moorlands | 0.5 |
| South Derbyshire | 0.6 |
| Oadby and Wigston | 0.8 |
| Tewkesbury | 0.8 |
| West Devon | 0.9 |
| North East Dumbartonshire | 1.2 |
| Forest of Dean | 1.6 |
| Corby | 2.1 |
| Bolsover | 2.2 |
Taking all unitary authorities and including the London boroughs, it is no surprise that with the exception of Crawley the remaining boroughs in the top 10 rail usage per head of population are London boroughs especially those with main line rail termini located within them and those south of the river which have limited London Underground services.
Table 8: Rail use per head of population (ten highest) – all unitaries
| Lewisham | 128 |
| Richmond Upon Thames | 130 |
| Kigston Upon Thames | 139 |
| Wandsworth | 153 |
| Crawley | 165 |
| Southwark | 223 |
| Camden | 358 |
| Lambeth | 439 |
| Westminster | 592 |
| City of London | 9,620 |
It is clear that rail use across the country varies considerably; influenced by history and its impact on the shape of the rail network, the extent to which authorities are centres of employment for a wider catchment area or are sources of workers for those centres and or the degree to which authorities are broadly self contained with relatively little in or out commuting or links to other areas outside their immediate locality.

John Siraut, Director - Economics, Colin Buchanan